
Dhruv Joglekar ,Vikas Sehgal : Why $20,000 Gold Would Be Bad News for Everyone

Why $20,000 Gold Would Be Bad News for Everyone Why $20,000 Gold Would Be Bad News for Everyone If gold ever trades at $20,000 an ounce, it won’t mean the world is richer. It will mean the world’s financial foundation has cracked. Gold does not rise like that because people suddenly fall in love with gold. It rises like that when people lose faith in what gold is priced against—chiefly U.S. dollars and U.S. government bonds. Historically, every explosive move in gold has coincided not with prosperity, but with stress in the monetary system. The 1970s. The post-2008 era. The post-pandemic period. The pattern is consistent. A $20,000 gold price would not be a commodity signal. It would be a credibility signal. Most people think U.S. government bonds are just another investment asset. They are not. For sovereigns, they are savings accounts. They sit at the core of national balance sheets, backing currencies, pension systems, banks, and insurance companies. As of 2024, foreign countries hold roughly $7.5 trillion of U.S. Treasuries (U.S. Treasury TIC data). Japan alone holds about $1.1 trillion, China around $800 billion, with Europe, the UK, and oil exporters making up much of the rest. These are not trading positions. They are reserves. When those bonds lose real value, the loss does not disappear into theory. It shows up directly on sovereign balance sheets, pension solvency calculations, and banking capital ratios. One country’s debt is another country’s asset. If the asset stops protecting purchasing power, the damage propagates outward. At $20,000 gold, the message would be unmistakable: Treasuries no longer preserve value in real terms. That message would already imply years of failed financial repression, negative real yields, and monetization. The chain reaction is mechanical. Countries holding large quantities of Treasuries appear weaker overnight. Their own government bonds, backed by those reserves, are suddenly questioned. Funding costs rise. Currencies come under pressure. Central banks are forced to intervene, burning reserves that markets already distrust. This is not a stock-market problem. It is a sovereign credibility problem. Equity markets can recover from crashes. Reserve assets do not recover trust once it is lost. The UK sits near the front of the fault line. The country runs a persistent current-account deficit, importing more than it exports. It depends on continuous foreign capital inflows to function. Its pension system is large, yield-sensitive, and structurally leveraged. In 2022, a modest rise in yields nearly collapsed the system, forcing the Bank of England into emergency bond purchases to stabilize pension funds (Bank of England Financial Stability Report, 2022). That was during a localized shock. In a global bond crisis—signaled by a vertical move in gold—the UK would almost certainly require external support. And that support would still be denominated in the very dollar system under stress. Liquidity can delay consequences. It cannot restore trust. Japan’s problem is scale. Its government debt exceeds 250 percent of GDP (IMF World Economic Outlook). The system works because yields are suppressed and reserves are assumed to be stable. If reserve assets weaken materially, Japan faces an impossible trilemma: defend the yen, defend the bond market, or defend economic growth. It can pick two on a good day. In a global crisis, it can pick one. Europe appears more insulated, but only on the surface. Stability there rests on institutional trust—shared fiscal rules, mutual confidence, and the belief that stress in one member state will not infect the rest. A global bond shock tests that belief directly, particularly for highly indebted countries where debt-to-GDP ratios already exceed 120–140 percent (Eurostat). Gold at $20,000 would strain that trust faster than any election ever could. China looks different. Its reserve composition is less bond-heavy. It holds fewer foreign government securities and more real assets—commodities, domestic savings, infrastructure, and gold. According to the World Gold Council, China has been the largest official buyer of gold for several consecutive years, while also absorbing most of its domestic mine production internally. Capital controls further reduce the risk of sudden reserve flight. At very high gold prices, China does not need to announce any return to a gold standard. It simply appears more solvent by comparison. In a crisis, relative solidity matters more than absolute purity. This is not a prediction. It is a warning. Gold may not reach $20,000. But if it does, the problem will not be gold. The problem will be the silent realization that the world’s savings were built on assets that promised safety—but delivered dilution. At that point, gold is no longer an investment. It is a signal that the damage is already done. Written By Dhruv Joglekar & Vikas Sehgal Disclaimer This article is published for informational purposes only and does not constitute investment advice or analysis. The information presented has been sourced from public domains and has not been independently verified. Vasuki Group makes no representations or warranties regarding the accuracy, completeness, timeliness, or reliability of the content. Neither Vasuki Group nor its affiliates, directors, employees, or representatives shall be liable for any errors, omissions, or reliance on the information provided. This article does not constitute an offer, solicitation, or recommendation for any investment, securities transaction, or contractual engagement. Readers should conduct their own due diligence before making any financial decisions. Any views expressed are those of the author and do not necessarily reflect the opinions of Vasuki Group. Further, Vasuki Group may hold or take positions in the market that differ from the views expressed in this article. All rights reserved. Vasuki Group reserves the right to update or modify this article at its discretion. For more information, reach out to us on research@vasukiindia.com.
Dhruv Joglekar ,Vikas Sehgal : Where Did the Gold Go?

Where Did the Gold Go? Where Did the Gold Go? Where Did the Gold Go? Gold is one of the rare assets where we can make a reasonable estimate of total supply. According to the World Gold Council, about 216,000 to 220,000 tonnes of gold have been mined over all of human history. Because gold does not rust, decay, or disappear, almost all of it still exists today—locked away as jewelry, bars, coins, or official reserves. Each year, global mining adds only 3,000–3,500 tonnes, about 1 to 1.5 percent of the existing stock. In practical terms, gold is almost a closed system. What matters is not how much is produced, but who absorbs it—and whether it ever comes back to the market. That leads to a simple but powerful rule: whoever steadily buys gold and does not sell it eventually gains control over the system, even if they do so quietly. Gold production today is concentrated in a small group of countries. China has been the world’s largest producer since 2007, mining roughly 350–400 tonnes a year. Russia, Australia, South Africa, and a few others follow. But production alone does not explain what has happened to the global gold stock. The real story begins after the gold leaves the mine. This is where China becomes central—and where global perception lags reality. Gold is unlike most commodities because it has a buyer with unlimited patience: central banks. Central banks do not trade gold. They accumulate it and store it. Once gold enters a central bank vault, it effectively disappears from the active trading market. As of 2024, central banks officially hold about 37,000 tonnes of gold, roughly 17 percent of all gold ever mined. Official rankings suggest the United States dominates this landscape, reporting 8,133 tonnes—by far the largest declared reserve. China, by contrast, officially reports only about 2,300 tonnes. On paper, the gap looks enormous. But paper is exactly the issue. Americans now claim ownership of roughly 40 percent of all bitcoins ever mined, while China controls close to 20 percent of all the gold ever extracted from the earth. The contrast is not cultural or technological; it is structural. One system maximized financial abstraction and mistook liquidity for control. The other accumulated physical finality. Digital assets depend on continuous operation—markets, power, networks, and law. Gold depends on none of these. When systems compress, accounting claims lose priority and custody asserts itself. What matters then is not who maintains the ledger, but who holds the asset that settles without permission. The United States last conducted a full audit of its gold reserves in the 1950s. Since then, the reported number has barely changed, despite enormous changes in the global monetary system. The figure may be accurate—but it rests largely on trust. China operates differently. Start with domestic production. Over the past two decades, China has mined roughly 7,000–8,000 tonnes of gold. Chinese law prohibits the export of domestically produced gold. Once it is mined, it stays inside the country. That fact alone puts China’s internal gold stock well above its officially reported reserves. Next come imports. Since the 2008 financial crisis, China has been a steady buyer of gold through global hubs such as London and, most visibly, Switzerland. Swiss customs data show thousands of tonnes of gold flowing east over the past decade. Much of this gold is recast into 1-kilogram bars, the format preferred by Chinese banks and institutions. Analysts who track refinery output and bar flows estimate that 4,000–5,000 tonnes have moved east this way alone. Then there are bilateral and off-market transactions. China has accepted gold as payment for goods and infrastructure from countries facing sanctions or dollar shortages, such as Iran. It has also reportedly received gold directly or indirectly through energy and weapons trade with Russia. These deals rarely pass through transparent markets and are not captured in official reserve statistics. Finally, there is domestic absorption. Chinese households are among the largest gold buyers in the world, using gold jewelry and bullion as a parallel savings system. At the same time, state-owned banks, policy banks, and state enterprises hold physical gold on their balance sheets under categories like “bullion” or “precious metals.” These holdings do not appear in central-bank reserve data reported to the IMF. Put all of this together—domestic mining, Swiss imports, sovereign transactions, gold-for-goods trade, institutional holdings, and household ownership—and a very different picture emerges. Conservative estimates suggest China controls more than 15,000 tonnes of gold. Less conservative, but still plausible, estimates place the number closer to 25,000 tonnes. Including private holdings, China may effectively control over 20 percent of all the gold ever mined on Earth. Not officially. Not transparently. But functionally. And unlike Western gold, much of this metal is immobile. It is not sitting in ETFs. It is not lent into the market. It does not circulate through bullion banks. It is held—quietly, patiently, and strategically. The rest of the world, meanwhile, behaves like a pigeon in front of a cat—eyes shut, hoping nothing changes. Yet the implications are profound. A country that can stare down the United States in trade wars, dominate rare-earth supply chains, and still hold enough gold to potentially back a large share of its currency presents a deeply unsettling scenario for the global financial system. Something has already changed. For the first time since the age of imperial treasure fleets—since the era of Zheng He—China has accumulated a share of the world’s ultimate monetary asset that rivals historic empires. Not to signal power. Not to trade. But to insulate itself and wait. Gold hasn’t vanished. It has simply moved east—and it is unlikely to return anytime soon. Written By Dhruv Joglekar & Vikas Sehgal Disclaimer This article is published for informational purposes only and does not constitute investment advice or analysis. The information presented has been sourced from public domains and has not been independently verified. Vasuki Group makes no representations or warranties regarding the accuracy, completeness, timeliness, or reliability of the content.
Harshit Dand : India’s Naval Build-Up: The Rise of a Strategic Shipbuilding Power
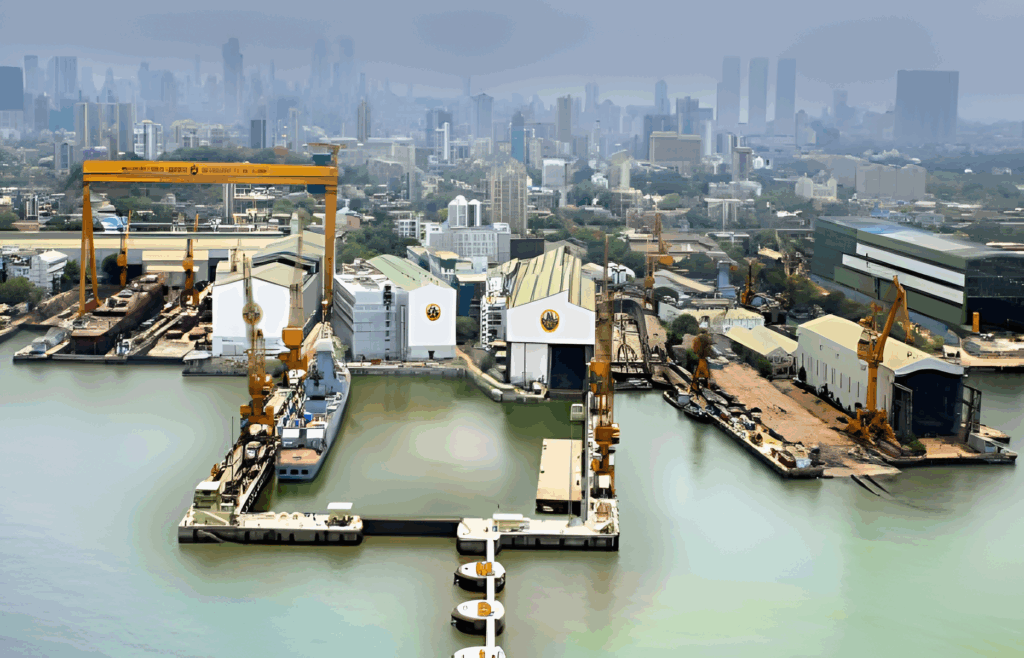
India’s Naval Build-Up: The Rise of a Strategic Shipbuilding Power Setting the Context: Why Naval Power Matters More Than Ever India’s defence shipbuilding sector is entering a long-term growth phase, evolving from a strategically reserved sector into a key pillar of national security and manufacturing. Backed by a strong naval modernisation pipeline and policy support, this shift is strengthening maritime deterrence and reducing import dependence. The Global Naval Balance: Where India Stands Today Image Source: Nuvama & Philip Capital Research Reports While India operates a balanced naval fleet, its overall strength remains significantly smaller than that of China, the United States, and Russia. This gap underlines the need for sustained and long-term naval expansion. Two-Front Maritime Reality: The China-Pakistan Axis India’s maritime security is increasingly shaped by a two-front challenge, driven by China’s growing presence in the Indian Ocean and Pakistan’s expanding naval capabilities. This coordinated pressure raises the need for stronger sea-lane control, credible deterrence, and a larger, more technologically advanced naval fleet. Present Naval Capability and the Target Fleet Vision While India’s warship fleet is currently modest, it is expanding rapidly. With over 60 ships under construction, 70-80 more planned, and a target of ~175-200 warships by 2035, India is undertaking one of its largest naval buildouts- focused on indigenised, high-value platforms rather than just numbers. The Next Decade of Shipbuilding: Major Platforms in the Pipeline Over the next decade, India’s naval shipbuilding pipeline spans submarines, frontline warships, amphibious vessels, and support platforms- together representing an opportunity of nearly Rs. 3 lakh crores. The navy is now ordering entire ship classes in larger numbers, signalling a shift from one-off projects to continuous fleet expansion and long-term visibility. Image Source: Philip Capital Research Report Policy as a Force Multiplier: Government Push Behind the Sector Defence shipbuilding push is driven by a clear policy framework, not demand alone. Reforms under the Defence Acquisition Procedure (DAP) prioritise domestic procurement, higher indigenous content, and long-term contracts, while supporting technology transfer and defence exports. Together, these policies are strengthening India’s shipbuilding ecosystem. Following the Money: Defence and Naval Capex on a Structural Uptrend Image Source: Philip Capital Research Report Naval modernisation is now firmly backed by rising capital allocation. Naval capex has more than doubled since FY18, while warship procurement has nearly tripled- raising the navy’s share of defence capital outlay to the mid-teens. This sustained increase shows that shipbuilding is a long-term strategic priority, not a cyclical spends. Image Source: B&K Research Report This naval expansion sits within a structurally rising defence capex cycle. Capital expenditure now makes up around 20-25% of total defence spending and is expected to grow at a high-teens pace, with the navy’s share steadily increasing to support fleet renewal and shipbuilding. Beyond Steel and Hulls: Indigenisation, Technology & Electronics Modern warships are highly complex systems that combine propulsion, sensors, weapons, and software into a single combat platform. India has moved well beyond hull construction to successfully design and integrate many of these systems, with warships showing strong execution and design maturity. Indigenous content has risen from under 30% in the early 2000s to ~70% in current destroyers and frigates, with upcoming platforms targeting up to 90%. Importantly, electronics now account for ~ 30–40% of a warship’s value- covering combat management systems, radars, sonars, EW, communications – many of which are increasingly developed domestically. Import dependence is being reduced through higher indigenisation, technology transfer with global peers, and rising domestic R&D. This shift is guided by the Technology Perspective and Capability Roadmap (TPCR), a 15-year blueprint issued by India’s Ministry of Defence that aligns shipbuilding with future technologies such as advanced propulsion, autonomy, sensors and EW, steering India toward a technology-driven, self-reliant, and future-ready naval force. Image Source: Technology Perspective Capability Roadmap 2025 Unlocking the Non-Defence Opportunity in Shipbuilding Beyond defence, commercial shipbuilding and ship repair offer a strong adjacent opportunity to Indian shipyards. Despite handling nearly 95% of India’s trade by sea, India accounts for less than 1% of global commercial shipbuilding. Image Source: Mazagon Dock Shipbuilders Shipyard in Mumbai To bridge this gap, the government has launched a Rs. 70,000 crore Shipbuilding & Maritime Development package, granted infrastructure status, and introduced financial assistance and interest subvention, and is developing coastal shipbuilding and repair clusters to improve competitiveness and scale MRO activity. Sources: Industry research reports, company disclosures, government publications, and official press releases. Written By : Harshit Dand Disclaimer This article is published for informational purposes only and does not constitute investment advice or analysis. The information presented has been sourced from public domains and has not been independently verified. Vasuki Group makes no representations or warranties regarding the accuracy, completeness, timeliness, or reliability of the content. Neither Vasuki Group nor its affiliates, directors, employees, or representatives shall be liable for any errors, omissions, or reliance on the information provided. This article does not constitute an offer, solicitation, or recommendation for any investment, securities transaction, or contractual engagement. Readers should conduct their own due diligence before making any financial decisions. Any views expressed are those of the author and do not necessarily reflect the opinions of Vasuki Group. Further, Vasuki Group may hold or take positions in the market that differ from the views expressed in this article. All rights reserved. Vasuki Group reserves the right to update or modify this article at its discretion. For more information, reach out to us on research@vasukiindia.com.
Dhruv Joglekar : Silver in now in the limelight amid new U.S. Tariff Regime and Strong Fundamentals

Silver in now in the limelight amid new U.S. Tariff Regime and Strong Fundamentals Why Silver Is Capturing Attention 1. Tariff Triggered Safe-Haven Demand New U.S. tariff measures have revived fears of stagflation and disrupted supply chains, prompting investors to seek refuge in precious metals. Gold responded immediately, and silver followed—benefiting not just from its safe-haven status but also its industrial demand profile. (Image source: Reuters) 2. Undervaluation via the Gold–Silver Ratio The gold-to-silver ratio remains historically elevated, pointing to silver’s relative undervaluation. A reversion toward long-term norms often results in silver outperforming. This dynamic is drawing investor interest and inflows. (Image source: Crescat capital) 3. Persistent Supply Deficit For a fifth year running, silver supply (mining plus recycling) fails to meet industrial and investment demand, particularly from sectors like solar and EVs. Disruptions in mining and refining could tighten supply further. 4. Record ETP Inflows In H1 2025, cumulative net inflows into silver ETPs reached 95 million ounces—already surpassing 2024’s totals—with total holdings climbing to 1.13 billion ounces, just 7% below the February 2021 peak. June alone accounted for nearly half of the inflows, the largest monthly surge since the 2021 Reddit-driven rally. 5. Macro Tailwinds Rate Outlook: Ongoing trade-headline volatility and moderation in inflation could prompt the Fed to begin easing later in 2025. Dollar Pressure: Tariff and growth concerns are weighing on the U.S. dollar, bolstering demand for dollar-denominated assets like silver. Sources: Reuters, The Silver Institute, Mining.com, FXStreet, GlobeNewswire, Futunn, CaratX, TrotterInc, InvestingNews and Kitco Written by: Dhruv Joglekar Disclaimer This article is published for informational purposes only and does not constitute investment advice or analysis. The information presented has been sourced from public domains and has not been independently verified. Vasuki Group makes no representations or warranties regarding the accuracy, completeness, timeliness, or reliability of the content. Neither Vasuki Group nor its affiliates, directors, employees, or representatives shall be liable for any errors, omissions, or reliance on the information provided. This article does not constitute an offer, solicitation, or recommendation for any investment, securities transaction, or contractual engagement. Readers should conduct their own due diligence before making any financial decisions. Any views expressed are those of the author and do not necessarily reflect the opinions of Vasuki Group. Further, Vasuki Group may hold or take positions in the market that differ from the views expressed in this article. All rights reserved. Vasuki Group reserves the right to update or modify this article at its discretion. For more information, reach out to us on research@vasukiindia.com.
Dhruv Joglekar : Impact of Recent U.S. Tariff Hikes on Indian Metal Exports: A Legal and Economic Perspective

U.S. Tariff Impact on Indian Metal Exports Impact of Recent U.S. Tariff Hikes on Indian Metal Exports: A Legal and Economic Perspective Date: July 2025 The U.S. government’s recent policy actions on metal tariffs have generated discussion across global trade corridors. This article outlines the current tariff environment, assesses potential escalation risks, and evaluates the impact on India’s metal exports to the United States. All data is based on publicly available sources from official trade bodies and media reports. A. Tariff Situation: Then and Now In March 2025, the United States imposed a 25% tariff on all steel and aluminium imports, covering both raw and finished products1. This was subsequently raised to 50% on June 3, 2025. India responded by filing a formal notification at the World Trade Organization (WTO), expressing its intent to impose reciprocal tariffs on certain U.S. goods. B. Outlook: Can Tariffs Increase Further? While the tariffs are now at 50%, the probability of a further increase is considered low. From a policy and diplomatic standpoint, 50% is viewed as a high-water mark in current trade dynamics. Comparable tariffs have been levied on other U.S. trading partners such as Canada, suggesting a level playing field is being maintained5. Analysts also speculate that a potential trade agreement with India could lead to more targeted tariff applications, focusing on specific product categories rather than a flat rate. India also maintains its own protective mechanisms—such as a 12% safeguard duty on select flat steel imports from China—which may mitigate some of the external pressure from U.S. tariffs. C. Trade Exposure: How Important Is the U.S. to Indian Metal Exports? India’s steel exports to the United States are relatively limited, while aluminium exports are more material. Only about 5% of India’s total steel production is exported; of this, roughly 1% goes to the U.S. In contrast, approximately 47% of India’s aluminium production is exported, with the U.S. accounting for 6% of those exports. From the U.S. side, over half of its aluminium imports come from Canada, and only about 3% come from India. For steel, major U.S. import sources include: Canada (23%) Brazil (16%) Mexico (12%) South Korea (10%) In FY25, India exported an estimated USD 4.56 billion worth of iron, steel, and aluminium products to the United States: $587.5 million in iron and steel $860 million in aluminium and related articles $3.1 billion in articles of iron or steel D. Historical Context: Is This a First? No. The aluminium and steel industries have previously been subject to U.S. trade actions. In January 2018, the U.S. administration under President Donald Trump imposed a 10% tariff on aluminium and 25% on steel imports from most countries, excluding Australia. These measures aimed to boost domestic production but were met with mixed results. U.S. aluminium production actually declined after the tariffs. Historically, such tariffs had limited impact on global benchmark prices, including those on the London Metal Exchange (LME). Conclusion While the latest U.S. tariff increases are significant, India’s direct exposure—particularly in steel—is limited. Aluminium exports are more impacted but remain a small part of overall U.S. imports. The situation remains fluid, and upcoming trade negotiations will play a key role in determining the long-term outcome. Sources Reuters – “Trump to sign order doubling metals tariffs” (June 3, 2025) Times of India – India plans retaliatory tariffs under WTO (May 13, 2025) Economic Times – India revises retaliatory duties plan (July 10, 2025) Reuters – “Explainer: The reality of Trump’s steel and aluminium tariffs” (June 2, 2025) Moneycontrol – “India may hit back at US with tariffs on almonds, metals” (June 2025) Reuters – “India mulls retaliatory tariffs as US rejects WTO notice” (June 2, 2025) Reuters – “US aluminium premiums hit record levels after tariffs” (June 5, 2025) U.S. Geological Survey – Mineral Commodity Summaries 2025 (Aluminium) U.S. Department of Commerce – SIMA Steel Import Reports DGFT India – Export-Import Data FY25 U.S. Federal Register – Proclamation 9704 (January 2018 tariffs) International Aluminium Institute – Primary Production Statistics London Metal Exchange – Historical Aluminium & Steel Price Data Written by: Dhruv Joglekar Disclaimer This article is published for informational purposes only and does not constitute investment advice or analysis. The information presented has been sourced from public domains and has not been independently verified. Vasuki Group makes no representations or warranties regarding the accuracy, completeness, timeliness, or reliability of the content. Neither Vasuki Group nor its affiliates, directors, employees, or representatives shall be liable for any errors, omissions, or reliance on the information provided. This article does not constitute an offer, solicitation, or recommendation for any investment, securities transaction, or contractual engagement. Readers should conduct their own due diligence before making any financial decisions. Any views expressed are those of the author and do not necessarily reflect the opinions of Vasuki Group. Further, Vasuki Group may hold or take positions in the market that differ from the views expressed in this article. All rights reserved. Vasuki Group reserves the right to update or modify this article at its discretion. For more information, reach out to us on research@vasukiindia.com.
Deepak Pawar – Navigating Uncertainty: How the Iran-Israel War Threatens India’s Trade Flows

Navigating Uncertainty: How the Iran-Israel War Threatens India’s Trade Flows Synopsis: The ongoing Iran-Israel conflict poses significant risks to India’s trade, especially due to rising crude oil prices, disruptions in shipping routes, and increased insurance and freight costs. As tensions between Iran and Israel escalate, the economic tremors are being felt far beyond the Middle East. For India—deeply integrated into global trade and heavily reliant on energy and fertilizer imports—the conflict poses serious macroeconomic and sectoral challenges. Disruptions in shipping lanes, rising freight costs, and supply chain vulnerabilities are already beginning to strain key industries. Trade Disruption and Export Exposure In FY2025, India exported goods worth $1.24 billion to Iran and $2.15 billion to Israel, while importing $441.9 million and $1.61 billion from these countries, respectively. However, the broader threat lies in the disruption of key maritime routes. The Strait of Hormuz and the Red Sea—which together handle nearly 80% of India’s merchandise trade with Europe and a significant portion of trade with the US—are now under threat. These regions account for 34% of India’s total exports. Map of Strait of Hormuz: Wikipedia Source: commerce.gov.in Source: Vasuki India – Strategic Research Risk to Indian Export War risk premiums for containers have surged from $50–$200 to $200–$400. Transit times via the Cape of Good Hope are increasing by 15–20 days, raising freight and insurance costs by a similar margin. India’s exports to Israel have already dropped from $4.5 billion in FY24 to $2.1 billion in FY25, while imports fell from $2.0 billion to $1.6 billion. Sectoral Impact Several of India’s high-performing export sectors are particularly vulnerable: Pharmaceuticals, which rely on stable access to Middle Eastern and North African markets. Textiles and home furnishings, especially to Israel, where margins are 10–15% higher than in the US. Gems and jewellery, electronics, and engineering goods, which face both demand-side risks and supply-side shocks—particularly from disruptions in Israel’s rough diamond exports. Basmati rice exports to Iran, India’s third-largest buyer, are expected to decline. In FY25, India exported ₹6,374 crore worth of Basmati rice to Iran, accounting for 12.6% of total Basmati exports. Fertilizer Sector: A Fragile Supply Chain India’s fertilizer sector is especially exposed due to Iran-Israel war. Nitrogen fertilizers like urea depend on ammonia, derived from natural gas—60% of production costs stem from this input. Phosphorus fertilizers like Diammonium Phosphate (DAP) require phosphate rock and sulphur, while potassium fertilizers rely on potash ore. Global fertilizer Supply: The Middle East and North Africa (MENA) region supplies over 30% of the world’s nitrogen fertilizers. Iran exports over 16 million tonnes of urea annually. Morocco holds 70% of global phosphate rock reserves. Russia and Belarus account for nearly 40% of global potash capacity. Any disruption in these supply chains—whether from sanctions, shipping delays, or conflict escalation—could trigger a lagged price shock. Within 1.5 to 2 months, fertilizer prices may rise sharply. Farmers, facing higher input costs, may reduce usage, leading to lower agricultural yields. Prices of Di-ammonium Phosphate (DAP) and Urea USD/T on June 17, 2025 Ripple Effects in India The Indian government may be forced to increase fertilizer subsidies, straining the fiscal deficit. If subsidies are not scaled up, food inflation could rise, especially in rural areas. The war could lead to rise in Energy Prices and Inflationary Pressure. The conflict has already pushed Brent crude oil prices to $76 per barrel, with a 12% surge since the escalation began. JPMorgan warns that prices could reach $120 per barrel in a worst-case scenario. A $10 increase in crude oil raises India’s oil import bill by ~ $12–13 billion annually, widening the current account deficit by ~ 0.3% of GDP. The Indian rupee has already weakened to ~ ₹86 per USD, adding to import costs. Higher oil prices could also impact sectors like paints, tyres, cement, and chemicals, which rely on crude derivatives. Written by: Deepak Pawar Disclaimer This article is published for informational purposes only and does not constitute investment advice or analysis. The information presented has been sourced from public domains and has not been independently verified. Vasuki Group makes no representations or warranties regarding the accuracy, completeness, timeliness, or reliability of the content. Neither Vasuki Group nor its affiliates, directors, employees, or representatives shall be liable for any errors, omissions, or reliance on the information provided. This article does not constitute an offer, solicitation, or recommendation for any investment, securities transaction, or contractual engagement. Readers should conduct their own due diligence before making any financial decisions. Any views expressed are those of the author and do not necessarily reflect the opinions of Vasuki Group. Further, Vasuki Group may hold or take positions in the market that differ from the views expressed in this article. All rights reserved. Vasuki Group reserves the right to update or modify this article at its discretion. For more information, reach out to us on research@vasukiindia.com.
Deepak Pawar – India’s 2025 Monsoon Outlook: Foodgrain Output, Sugar Sector Stability, and Evolving Fertilizer Trends

Monsoon Outlook 2025 India’s 2025 Monsoon Outlook: Foodgrain Output, Sugar Sector Stability, and Evolving Fertilizer Trends India is expected to receive above-average rainfall in 2025, with projections at 105% of the long-term average of 868mm. The absence of El Niño conditions and the potential development of La Niña later in the season are contributing to the positive monsoon outlook. While most regions are likely to experience above-normal rainfall, certain areas in northwest, northeast, and southern Peninsular. For more details, please click here . Written by: Deepak Pawar Disclaimer This article is published for informational purposes only and does not constitute investment advice or analysis. The information presented has been sourced from public domains and has not been independently verified. Vasuki Group makes no representations or warranties regarding the accuracy, completeness, timeliness, or reliability of the content. Neither Vasuki Group nor its affiliates, directors, employees, or representatives shall be liable for any errors, omissions, or reliance on the information provided. This article does not constitute an offer, solicitation, or recommendation for any investment, securities transaction, or contractual engagement. Readers should conduct their own due diligence before making any financial decisions. Any views expressed are those of the author and do not necessarily reflect the opinions of Vasuki Group. Further, Vasuki Group may hold or take positions in the market that differ from the views expressed in this article. All rights reserved. Vasuki Group reserves the right to update or modify this article at its discretion. For more information, reach out to us on research@vasukiindia.com.
Deepak Pawar In Conversation with DD Sahyadri – Banda Rupaya, Sharing view on Equity Market, Agro Sector, Sugar sector and Chemical Sector.

Source: DD Sahyadri Deepak Pawar In Conversation with DD Sahyadri – Banda Rupaya, Sharing view on Equity Market, Agro Sector, Sugar sector and Chemical Sector. https://www.youtube.com/watch?v=xWndO4XJu7k
Dhruv Joglekar – INDIA’S PASSIVE FPI OUTFLOWS MAY SOON BOTTOM AS USDINR NEARS 88-89

India’s Passive FPI Outflows May Soon Bottom as USDINR Nears 88-89 INDIA’S PASSIVE FPI OUTFLOWS MAY SOON BOTTOM AS USDINR NEARS 88-89 Summary Passive Foreign Portfolio Investment (“FPI”) outflows from India may soon turn as USDINR moves towards 88-89. Historical trends show a median depreciation of 6.6% in trough-to-peak cycles over the last decade, with an average of 7.9%. If this pattern holds, the rupee could reach 88-89 by Q1 FY26, possibly reversing passive FPI outflows. Historical patterns indicate that major depreciations in USDINR tend to follow phases of appreciation. The most notable depreciation in recent history occurred during the 2013-14 Taper Tantrum when the currency fell by ~16% within 3-4 months after FPI flows peaked at $14.8 billion. A similar decline was seen in 2018 due to trade war concerns, a 100-bps Fed rate hike, and domestic uncertainties linked to GST implementation, resulting in $25 billion in FPI outflows. Given past trends, if current factors affecting the exchange rate persist, USDINR could rise to 88-89 by April-May FY26 based on median bottom-to-peak moves observed in previous years. Cycles of USDINR and FPI flows show average peak depreciation of 8.3% The US Economy and FPI Inflows: A Surprising Correlation Contrary to common belief, a stronger U.S. economy does not necessarily drive capital outflows from India. Analysis of the Citi U.S. Economic Surprise Index (CESI) and India’s net FII equity flows since 2014 suggests a 25% positive correlation. Additionally, econometric modeling indicates that a 1% positive surprise in U.S. economic data has historically driven an inflow of approximately $82 million into Indian equities, with a lag of around one month. Growth Surprises in the US are Generally Positive for India Flows Correlation between US 10-Year Bond Yields and Indian (or Emerging) Markets Historical data suggests a strong inverse correlation between U.S. 10-year bond yields and emerging market equities, including India. These asset classes often move in opposite directions, with rising U.S. bond yields drawing capital away from riskier markets. When the U.S. 10-year yield exceeds 4.3% to 4.4%, it often marks an inflection point where investors reallocate funds into U.S. bonds. In September 2024, the U.S. 10-year yield was at 3.6%, but it has since risen to 4.6%. This surge has coincided with significant capital flows into U.S. assets, strengthening the dollar and contributing to large-scale FII outflows from India. A 4.5% risk-free return in U.S. dollars presents an attractive alternative, particularly as emerging markets continue to trade at elevated valuations. US 10-year bond yields and Indian (or emerging) markets have high negative correlation (Source: Vasuki Research) Source: Vasuki Research Conclusion: Volatility Ahead, but Structural Strength Remains Although short-term market conditions remain uncertain, India’s long-term fundamentals continue to provide a solid foundation. Fiscal consolidation efforts, steady forex reserves, and resilient domestic flows support economic stability. While USDINR may weaken to 88-89, the expected reversal in passive FPI flows will be a critical development for investors tracking the evolving macroeconomic environment. For more information, reach out to us at research@vasukiindia.com. Disclaimer This article is published for informational purposes only and does not constitute investment advice or analysis. The information presented has been sourced from public domains and has not been independently verified. Vasuki Group makes no representations or warranties regarding the accuracy, completeness, timeliness, or reliability of the content. Neither Vasuki Group nor its affiliates, directors, employees, or representatives shall be liable for any errors, omissions, or reliance on the information provided. This article does not constitute an offer, solicitation, or recommendation for any investment, securities transaction, or contractual engagement. Readers should conduct their own due diligence before making any financial decisions. Any views expressed are those of the author and do not necessarily reflect the opinions of Vasuki Group. Further, Vasuki Group may hold or take positions in the market that differ from the views expressed in this article. All rights reserved. Vasuki Group reserves the right to update or modify this article at its discretion.
Deepak Pawar shares his views discussing general market movement, along with the current scenario of the Sugar and Chemical sectors on Banda Rupaya, DD Sahyadri.

Deepak Pawar was recently interviewed on Banda Rupaya, DD Sahyadri, Discussing general market movement, along with the current scenario of the Sugar and Chemical sectors. Stay tuned for insights! Source: DD Sahyadri https://www.youtube.com/watch?v=KOcU0FIHPQ0
Omkar Tanksale shares views on Infosys Vs TCS

Omkar Tanksale shares views on Infosys Vs TCS !! Here’s What Market Analysts Recommend To Pick In Trade … https://www.youtube.com/watch?v=UI_VVDxKEX0 Source: NDTV Profit
Deepak Pawar shares his views on Sugar, Textile and Insurance sector and on Banda Rupaya, DD Sahyadri.

Deepak Pawar featured on DD Sahyadri on 9th Aug, 2024 Source: DD Sahyadri
Deepak Pawar shares his views on Agro-Agrichem on Banda Rupaya, DD Sahyadri.

Deepak Pawar shares his views on Agro-Agrichem on Banda Rupaya, DD Sahyadri. Source: DD Sahyadri https://youtu.be/b50Trzxi_oY
Deepak Pawar – Agriculture Scenario in India and Future outlook

Agriculture Scenario in India and Future outlook El Niño and La Niña are climate patterns that affect the weather globally. El Niño refers to warmer ocean temperatures in the central-east equatorial Pacific, leading to various impacts like increased flooding and changes in marine life. On the other hand, La Niña involves cooler ocean temperatures in the same region, leading to effects like droughts and heavy rains in different parts of the world. India, along with asian countries faces low and scattered monsoon in El Niño and abundant to heavy rainfall in La Niña. Historical Impact of El-Niño: Past Challenges and Resilience In the past, El-Niño has caused difficulties for farming in India. It led to problems like less rain, affecting crops like rice and sugarcane. Historical data shows that during El-Niño events, agricultural production in India faced setbacks. Crops like rice and sugarcane were particularly impacted by El-Niño. Current Scenario: Facing Water Scarcity and Crop Challenges Currently Western, Central, and Southern regions in India are experiencing water scarcity which is affecting crops such as sugarcane and off-season plantations. Farmers are working hard to adapt to these conditions and find ways to sustain their crops. Water reservoir levels in many regions are lower than previous year as well as long term average. Water scarcity is significantly impacting regions like Northen, Eastern, and Southern India. However, Central region water reserves are at 10 year average while Western India has water availability at levels better than 10 year average but lower than last year. Sowing in Sugarcane, vegetables and pulses are facing challenges due to the scarcity of water. Future outlook: Anticipating Better Monsoon and Agricultural Growth According to initial forecasts by Sky met & IMD, India is likely to witness La Niña phenomenon i.e. return of normal monsoon 2024. The expectation of better rainfall brings optimism for increased agricultural production & fertilizer usage. This positive outlook signals a potential resurgence in agricultural productivity. Agriculture theme can be played in stock markets through sub segments like Seeds, fertilizers, Agrochemicals, Agri equipment’s manufactures & rural consumer products producers. Chart data source:India Meteorological Department Ministry Of Earth Sciences Government Of IndiaReserve Bank of IndiaSkymet Weather
Daljeet Singh Kohli explains why he is overweight on metals

Daljeet Singh Kohli explains why he is overweight on metals Daljeet Singh Kohli to ET Now – featured on 18th Mar, 2024 “Right now, we believe there is a lot of potential there mainly because valuation-wise they are not obscenely high. Second, the way the Indian government is putting focus on infrastructure development and especially after the elections, we expect a lot more push coming on to the infrastructure, so the demand from our side will remain very strong and currency, local as well as international, is in favour. All these factors make a conducive environment for metal stocks and therefore we are exposed to them.” One section of the market believes that the US economy may not be doing that badly. The macro data from China is also supportive. So, metal is the place to be. They are beaten down. There is also a view that if the slowdown continues in these two economies, this metal long trade may be very short lived. Do you believe in this trade or is it just a point A to point B and not worth making it a large part of the portfolio yet? See, we are right now very much overweight on metals. As of now, almost 8% to 10% of our portfolio is exposed to metals and normally metals is a technical call. So, metal is never a three-year, five-year lock-in story that you buy and forget and your next generation will look at it like that. We do not buy metal stock like that because there are so many things which work. There are so many moving parts there. Either it is global macros, it is local macros, then company specific issues. So, metals normally are a trading opportunity only and we have also taken that view. Right now, we believe there is a lot of potential there mainly because one is that valuation-wise they are not obscenely high. Second, the way the Indian government is putting focus on infrastructure development and especially after the elections, we expect a lot more push coming on to the infrastructure, so the demand from our side will remain very strong and currency, local as well as international, is in favour. All these factors make a conducive environment for metal stocks and therefore we are exposed to them.https://youtu.be/F0PA0rXotOw I want to draw your attention to Reliance Industries because even in the recovery that played out post Wednesday, Reliance had a big contribution. What do you think is fuelling the move on Reliance? This is the rotation towards large caps basically. If you have to take money out and there is so much talk about froth being built up in various segments. So, if the institutions are forced to or if they have to get out of certain smaller and mid stocks, then where does that money go? The natural progression is that it has to go to some largecap and within the largecap, probably Reliance is the first choice because it is valuation-wise not very costly. There are a lot of trigger points for the stock to perform. After quite a few months of consolidation, the stock had come out of that phase and started moving to the new highs. So, normally, people would want to go with a stronger stock when they are rotating out of some stocks and especially locking out their profit from those stocks. It is just that rotation which is happening. Trigger points for Reliance remain as it is. The new energy initiatives that they are taking, is a three-four years kind of call. It is not immediate that the profitability will start flowing in, but these days just a hint is enough. Semiconductor stocks are trading at 100 multiples. So yes. At least these guys are spending Rs 75,000 crore on new energy. The market is willing to give them that benefit. How would you play the capex theme right now? What are your favourite capital goods stocks or engineering ones that you have in your portfolio? We are adding some of them. As of now, I do not think we have any capex stock right now. Infrastructure, we have added two-three months back, some road project companies and those we have added. But machinery or cap goods per se, now we are evaluating three-four ideas there. Basically, we tend to go to the mid-end, the smaller ones, instead of just going to the L&Ts of the world and we try to find the niche areas. So, I think there are a couple of ideas which we are working on, maybe in the next one month or so we will be adding some. What about hospital stocks? There is the entire story brewing on how treatments would be regulated and it will be at par with the public sector hospitals. The entire space went through a correction and some of them started trading at 60-70-time one-year forward, still way off the mark from recent peaks. Would you be comfortable getting back there? I am very bullish on the sector as such because this is a place where we see a lot of potential for many years to go. We have such a huge population, penetration levels are so low and there is a huge scope for expansion for all these companies. Now of course you have to be mindful of valuations. Incidentally, in the last two-three years this sector has seen a lot of PE investments, a lot of private investments coming in which have just inflated the valuation to a very large extent. So, probably this Supreme Court ruling actually become a trigger point for people to take some profit out and bring back some sanity in the valuation. I think still valuations are on the frothy side. So, we will have to be very choosy amongst all these stocks. I am very bullish as I said on the sector, but one has to be very choosy while selecting the stock where at least some kind of
Looks like Gold is poised to shine the brightest!!!

Looks like Gold is poised to shine the brightest!!! What really moves gold prices? Real Rate of Return – A combination of Inflation & Interest Rates – moves Gold prices. What is a real rate of return? Real Rate of Return in simple language is: Interest Rate – Inflation If bank fixed deposit is paying 6% interest rate & inflation is 7%, the real return is 6% – 7% = -1% If inflation is 4%, your real return is 6% – 4% = 2% What’s the relationship between real rates & gold prices? Negative Real Rates (-1% in the above example) is supportive of gold prices Positive Real Rates (2% in the above example) works against gold prices Why is this so? Gold is a non interest-baring instrument i.e. does not pay any fixed interest. Hence, whenever rates drop, you make less fixed interest by investing incremental money in fixed income & hence it moves to Gold & When rates go up, you want to invest incremental money in Fixed income & not gold Hence, assuming inflation to be constant, you will invest more in Gold when Interest rate falls to 4% & inflation is 6% = -2% real rate and you will invest less in Gold when interest rate rises to 7% & inflation is 6% = 1% real rate Positive Real Rates (2% in the above example) works against gold prices Apart from Interest Rate & Inflation, does $(DXY) affect gold price? Yes. Gold is traded in $ terms. When $ increases/ strengthens, gold becomes expensive & hence demand is expected to fall & hence the price comes down. But when $ drops/ weakens, gold becomes cheap & hence demand is expected to rise & hence the price is expected to go up. Globally interest rates are expected to top out. Market is expecting rates rate cuts starting middle of 2024; & hence fixed income investors would lean more towards Gold as against fixed income assets When interest rates go down, the currency (Dollar in this case) is expected to soften as well. With this view, the expectation also is that softening dollar will be positive for gold.
The Red Sea issue and what it meant for India Inc

The Red Sea issue and what itmeant for India Inc The Red Sea crisis, also known as the U.S.-Iran proxy war, originated from Houthi rebels’ attacks on Israel in October 2023, causing significant disruptions to global trade via the Red Sea. This includes attacks on commercial vessels, leading to: Increased shipping costs: Ships are taking longer routes, raising fuel consumption and operational costs. Delays in delivery Rerouting adds significant time to shipments, impacting supply chains and potentially leading to shortages. Higher insurance premiums War risk insurance for the Red Sea has soared, adding to costs for businesses. The potential for further escalation remains, which could result in the shutdown of key trade routes, leading to price increases and economic instability worldwide. It’s important to note that the situation is ongoing and its full impact on global trade is still unfolding. However, the potential for significant disruptions and economic consequences remains high. Key point to note: The crisis predominantly affects trade between Europe and Asia, with India particularly vulnerable – with a large portion of its trade reliant on the Red Sea. India Inc – In Q3 2024 management discussion calls, the term ‘Red Sea’ was mentioned 48 times, primarily impacting industries such as Mining and minerals, Manufactured products, chemicals, plastics and rubber materials. Discussions revolved around: Increased freight costs Affecting export-oriented industries, notably steel, pharmaceuticals, and oil. 2. Delays in deliveries due to rerouting, especially impacting exports. 3. South African coal offered at discounted rates due to EU delivery disruptions, benefiting Indian industries. Delays in deliveries Due to rerouting, especially impacting exports. South African coal offered at discounted rates Due to EU delivery disruptions, benefiting Indian industries. As of Q3, the impact on most companies is marginal, with ongoing monitoring for potential future actions. Note: only the companies whose concall transcripts were available on Factset database as on February 8, 2024, are considered
Unravelling the US Banking Puzzle: The Commercial Real Estate Dilemma

Unravelling the US Banking Puzzle: The Commercial Real Estate Dilemma In the world of US banking, the spotlight has turned on the Commercial Real Estate (CRE) portfolio, stirring discussions following the acquisition of Silvergate Bank last year by New York Community Bank. The announcement of increased provisions in its CRE portfolio during the fourth-quarter results on January 31st resulted in a significant 57% decline in its stock and 8% fall in the regional banks index since the result date, as of the closing price on February 7th. This has prompted a closer look at the challenges faced by the sector. Other banks with high exposure to CRE including Zions Bancorp, Valley National Bancorp and Western Alliance Bancorp have also borne the brunt. What is driving this? High-Interest Rates The low-interest rate party of the past decade is officially over. The Federal Reserve’s decision to crank up the federal funds rate has thrown a curveball at the commercial property market. Loans taken at rock-bottom rates now need a refinance makeover at significantly higher rates. Office Vacancy Trends The surge in remote work, born during the COVID era, has elevated office vacancy rates to 19.6%. This shift has adversely affected property demand, potentially leading to defaults on associated loans. Anticipated Impact Delinquency rates are expected to rise as loans mature for refinancing, especially for banks heavily invested in the CRE rollercoaster. What is driving this? The drama seems to be localized, with major banks like JP Morgan and Bank of America sporting less than 5% exposure to the CRE theatrics. The impact appears to be concentrated among regional banks and select foreign banks having high exposure to CRE loans. Despite the CRE challenges, commercial property prices have managed to weather the storm, providing some stability in uncertain times. Also, CRE loan repayments are evenly distributed from 2023 to 2028, with the majority not falling due this year. Conclusion – Finding Balance: As US banks grapple with the intricacies of the CRE market, the overall impact on the economy appears to be manageable. Proactive measures, staggered repayments and the limited exposure of major institutions indicate a more localized challenge than a widespread economic crisis. Relevance in Indian context Indian banks are sipping their chai, unfazed. Stable interest rates, sustained demand for commercial property and a mere 3% exposure mean they’re not hitching a ride on this rollercoaster.