
ROME DIDN’T NOTICE EITHER
Hammersmith Bridge is about 250 metres long. The Victorians built it between 1884 and 1887, in roughly three years. It closed to motor traffic in 2019 and, seven years later, it is still closed.
Pedestrians and cyclists can cross; buses cannot. Its repair has become a three-way argument between a borough council, Transport for London and Whitehall over who should pay an estimated £300 million.
It is worth dwelling on that number. For less than £300 million, the entire deck of Hammersmith Bridge could have been covered in silver. We could, in other words, have plated the bridge in silver for less than the cost of arguing about fixing it. What London has instead is a beautiful, very expensive footpath.
I split my time between London and Dubai, and the contrast is hard to unsee. In Dubai, towers rise outside the same window year after year: somebody imagined them, got permission, found the money and the people, and finished them. Then I fly back to London, and a different question takes hold: what has happened to our ability to do difficult things together?
China built the 36-kilometre Hangzhou Bay Bridge in about five years, and the 55-kilometre Hong Kong–Zhuhai–Macao crossing, with its artificial islands and undersea tunnel, in under nine. London has now spent longer failing to put buses back across one short Victorian river crossing than China took to build some of the longest sea crossings on earth.
It would be convenient to blame this on democracy, and wrong. India, a loud, litigious, federal democracy, went from 74 operational airports in 2014 to 165 by July 2026. Not runways. Airports. Spain, a European democracy with the same environmental directives as Britain once had, built one of the world’s largest metro networks in Madrid for about £68 million a mile. London’s Elizabeth line cost about £1.4 billion a mile, twenty times more. Research by Britain Remade found British rail and road projects costing up to eight times their European equivalents. The problem is not the ballot box. It is us.
Nor is this a British peculiarity. In March 2024 a container ship struck the Francis Scott Key Bridge in Baltimore, an hour up the road from Washington. Six workers died. The replacement was first priced at $1.7–1.9 billion with a 2028 opening. The estimate has since risen to $4.3–5.2 billion and the target has slipped to late 2030. The bridge has not appeared. The cost has more than doubled.
HS2 is the purest case. It was sold at roughly £33 billion for a Y-shaped network running to Manchester and Leeds. In May 2026 the government put the cost of completing just the London–Birmingham stub at up to £102.7 billion, opening sometime between 2040 and 2043, at reduced speed. Three times the money for less than half the railway.
And then there is Heathrow’s third runway: the most thoroughly consulted strip of tarmac in human history. It has been argued over for more than two decades, longer than it took to dig the Channel Tunnel three times over. Parliament backed it in 2018. In 2026 it is back in policy consultation. It remains, in its purest form, a runway made entirely of paper.
An engineer can explain why each of these projects is complicated, and the explanation will usually be correct. The real question is why rich Western societies so reliably turn difficulty into delay, divided responsibility and cost, until the physical object becomes almost incidental.
Monuments are not interesting in themselves. What is interesting is what they reveal. A port, an aqueduct, a railway or a bridge demands money, materials, labour, engineering, logistics, long-lived authority and a public willing to suffer disruption today for a gain it may never personally enjoy. A great work is a physical photograph of a society’s instincts: its willingness to marshal resources, to settle arguments, to take risk and to believe the future is worth paying for.
A civilisation on the rise builds as though it expects to be around. It does not ask whether a railway will pay back within an electoral cycle; it cuts the line through the hill and lets the grandchildren count the returns. That confidence, those animal spirits, are the real asset. The stone and the steel are only the receipt.
The absence of building is also a photograph, and it is a darker one. When a society stops producing great works it is not simply saving money. It is telling you that it no longer believes in its own future strongly enough to inconvenience its present. It has lost the nerve to decide, the authority to finish and the instinct that once made it great. Incapacity to build is not a planning problem. It is the first visible symptom of decline.
A mature society is richer, kinder and far more careful. It wants, sincerely, to do social good: to protect every bat, consult every stakeholder, compensate every grievance and redistribute to every claim. Call it what it increasingly is, a woke state, in which the power to object has become more consequential than the duty to build. HS2 paid over £100 million for a kilometre-long shed to protect a colony of bats. Defra, according to evidence given to the House of Lords, has one member of staff for every five farmers. Each decision can be defended. Together they describe a system in which everybody can stop something and nobody is answerable for finishing anything.
I call this a quasi-socialist hybridocracy. Its danger is not any single policy. It is that a society slowly forgets what it is, what it has been and what brought it here, and mistakes the management of its inheritance for progress. Each step feels virtuous. The direction of travel is fatal.
History offers a test of whether this is anything more than a grumble. The Romans left us a record, and they left us its ending.
Rome produced aqueducts, roads, harbours, arenas, baths and walls in extraordinary numbers. The Colosseum went up in under a decade; Hadrian’s Wall crossed northern Britain in about six years.
To measure this, I built a working index from 100 major Roman projects, scoring each for engineering difficulty, scale, logistics and sophistication, then combining the difficulty of the hardest works in each half-century with how often major works appeared. The appendix sets out exactly how the numbers were built.
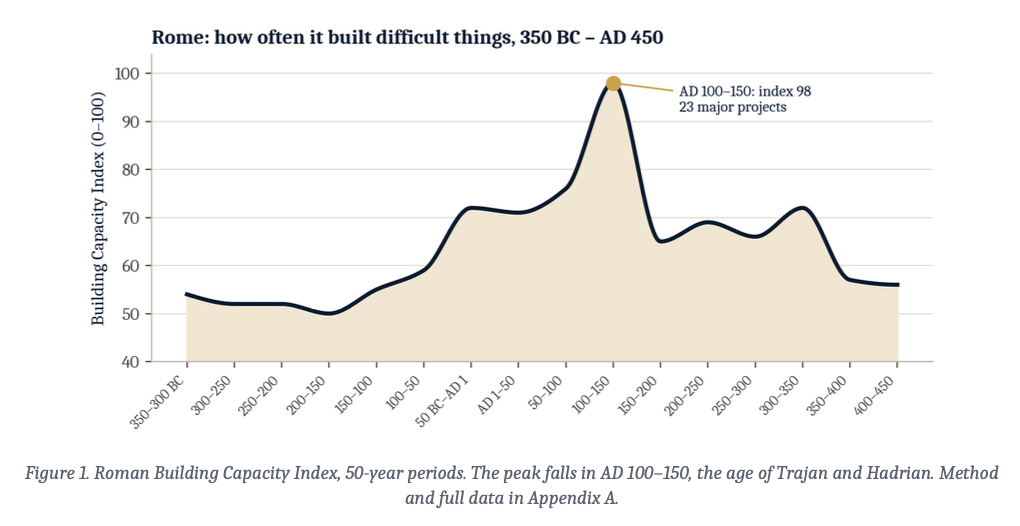
The curve climbs through the late Republic, peaks around AD 100–150 and then falls away. The crucial detail is why it falls. Later Rome did not forget how to build: the Baths of Caracalla, the Aurelian Walls and the Basilica of Maxentius are as formidable as anything that came before. What collapsed was frequency. Great works stopped being ordinary and became exceptional.
One curve built from monuments could be dismissed as taste or survivorship. So I put it beside three witnesses that have nothing to do with architecture. Lead trapped in Greenland ice records the smoke of Roman mines and smelters. The count of Mediterranean shipwrecks is the archaeologist’s rough gauge of seaborne trade. And the silver content of the denarius, later the antoninianus, tells us what the state was doing to its money.
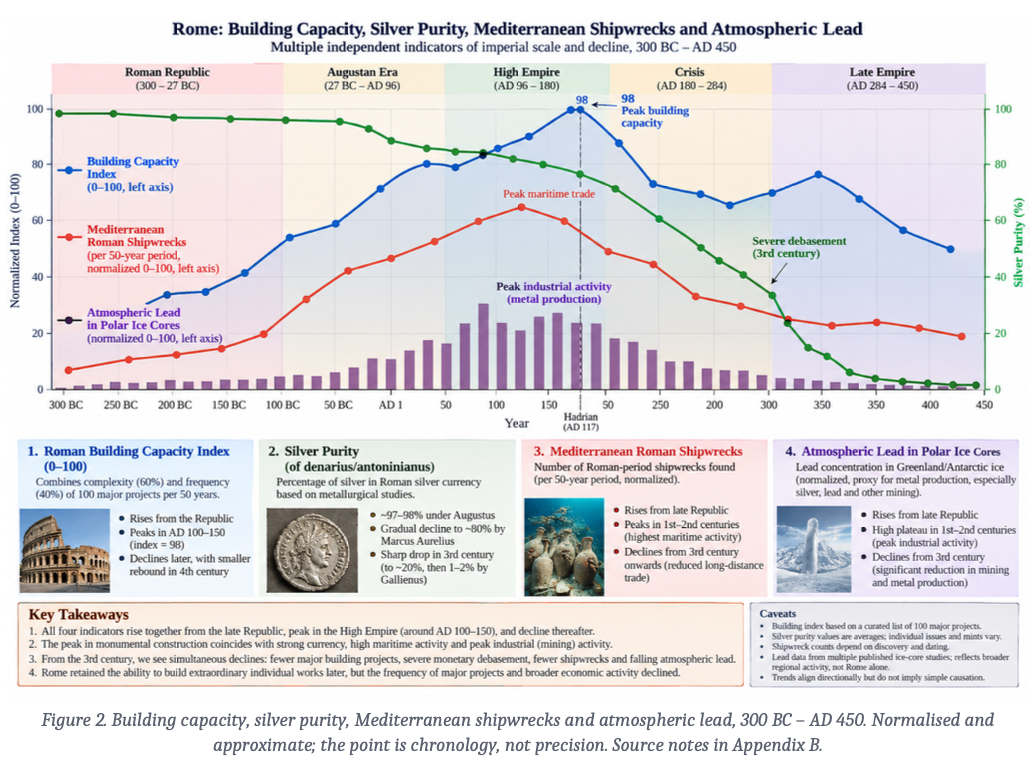
They tell the same story. Construction, trade and industry all rise together into the early Empire and peak within the same two centuries. Then they fade together, and as they fade the coin gives way. By the reign of Gallienus in the 260s, the principal “silver” coin held perhaps 1–2 per cent silver: a token dressed as money.
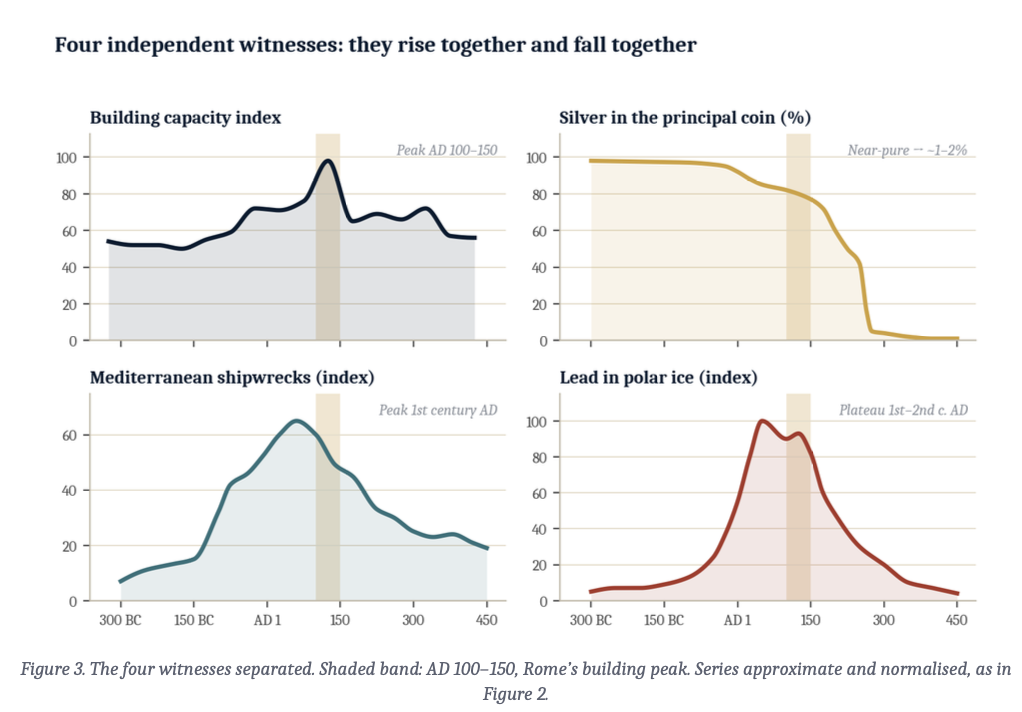
Four records produced by four entirely different human activities — building, trading, mining and minting — describe one machine running at full power, and then running down.
None of this says that debased coins knocked down aqueducts. It says something more uncomfortable: the loss of building frequency and the loss of sound money were parallel symptoms of the same change in the character of the state, from investing in the future to paying for the present.
Strip the same evidence back to its four parts and the pattern is impossible to miss. Each panel is a different human activity, measured by a different science, and each peaks in or near the same shaded half-century.
Britain offers the cleanest modern comparison, because its own age of audacity is so well documented. The Victorians dug sewers, cut the Underground, raised Tower Bridge and the Embankment, and laid some 16,000 miles of railway by 1870.
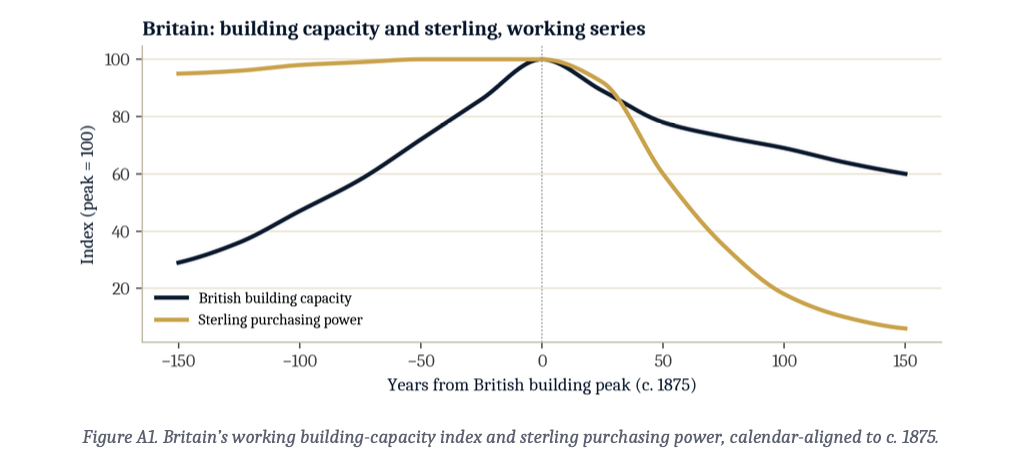
I applied the same scoring to 100 major British works, from the canals to Crossrail, and then did the one thing that makes a comparison across two thousand years possible: I set each civilisation’s calendar to zero at its own building peak. For Rome that is the age of Trajan and Hadrian; for Britain, roughly 1875.
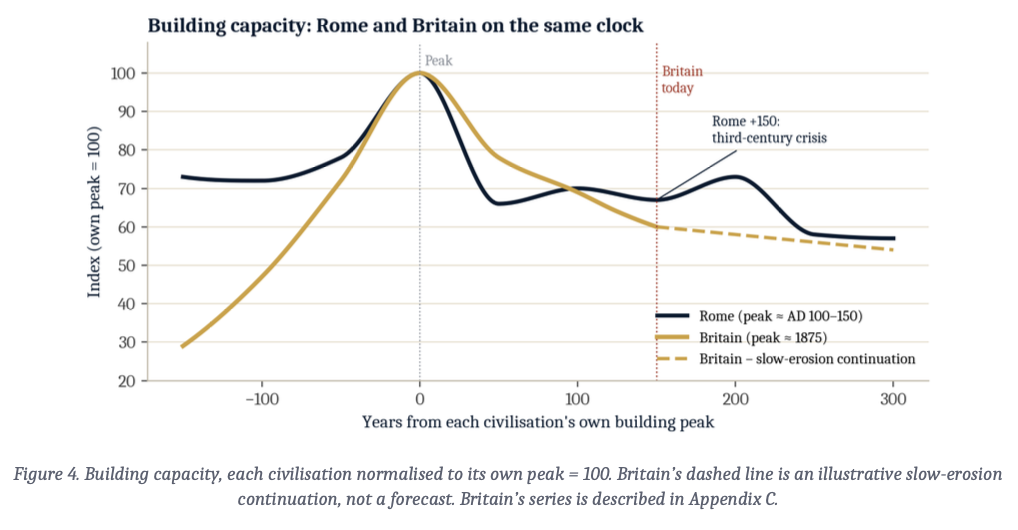
The shapes rhyme. Both rise steeply to a peak and then settle at roughly two-thirds of it. Britain today sits about 150 years past its peak, at around 60 on its own index. Rome, 150 years past its peak, was in the high 60s, and entering the third-century crisis.
Britain has not lost its engineers. Crossrail, the Tideway Tunnel and Hinkley Point C prove the capability survives. What has gone is the rhythm. The Victorians did such things constantly and simultaneously. We do them occasionally, late, and at a cost that makes each one a national event.
Now put the money on the same clock. Rome’s measure is the silver in its principal coin; Britain’s is what a pound actually buys. One is metallurgy, the other is inflation. But they measure the same thing: whether the state still keeps the promise stamped on its currency.
Through Britain’s building age the pound was tied to gold and barely moved. After the peak it held briefly, then fell off a cliff, and it fell faster than the denarius. On this working series a pound today keeps about six per cent of the purchasing power it had at the Victorian peak.
On the aligned clock, Britain now stands almost exactly where Rome stood around AD 275: just after the silver coin had touched its 1–2 per cent nadir under Gallienus, and just as Aurelian attempted a repair.
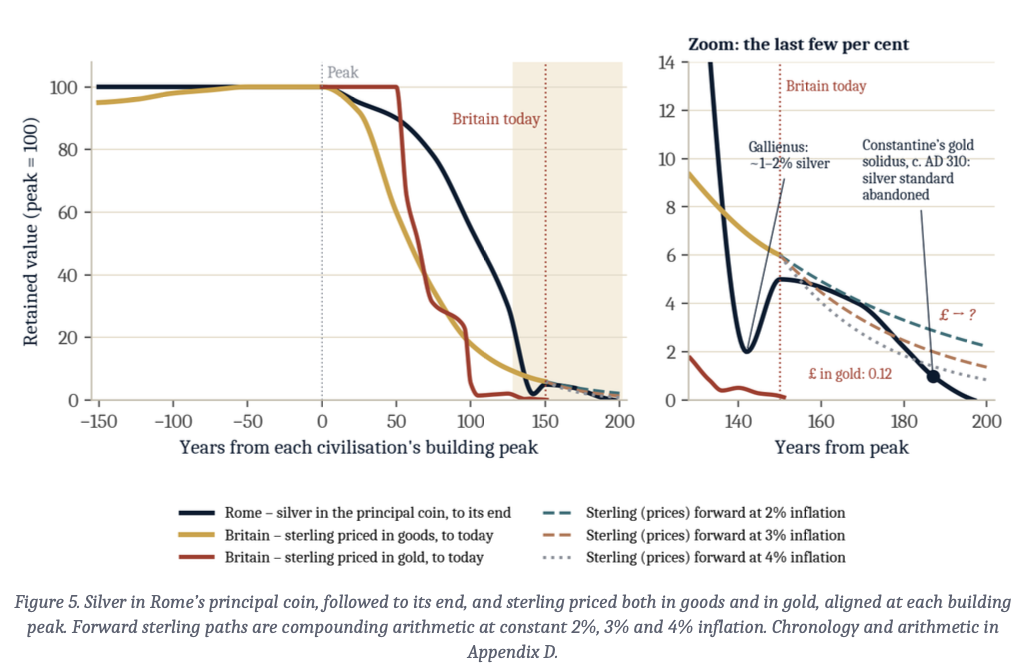
So let Rome finish its story. Aurelian’s repair was cosmetic. Diocletian’s great reform of AD 294 briefly revived a fine silver coin, but the money people actually used, the bronze nummus washed in silver, kept shrinking. Within two decades Constantine abandoned the pretence altogether and anchored the empire on a new gold coin, the solidus, around AD 309–312. The old silver standard did not recover. It ended, and the monetary order was rebuilt on a different metal and a different state.
A fair critic will say that a pound buying less is not the same as a coin losing its silver; Britons are far richer than in 1875. So measure the pound the way the Romans measured the denarius: in precious metal.
In 1875 an ounce of gold cost £3.89 at the Mint. In September 2026 it cost £3,218.50. Priced in gold, the pound has kept about 0.12 per cent of its Victorian value. The antoninianus under Gallienus kept one to two per cent of its silver.
On the only measure that is truly like-for-like, sterling has already fallen further than the Roman coin did before Constantine buried it.
Now look at the pound’s forward lines. At a perfectly “normal” 2 per cent a year, fifty more years takes the index from 6 to about 2.2. At 3 per cent, 1.4. At 4 per cent, 0.84, which is where the Roman coin stood on the eve of Constantine. The lines do not bend back up. Rome’s never did.
On the peak-aligned clock the Roman analogy does not say “X years until collapse.” It says the comparable Roman breaking point is approximately now, and the Roman sequel was the end of the old money.
Will sterling meet the same end? Nobody can know. But history has run this experiment before, and it did not end in a reprieve.
Britain today sits roughly where Rome stood around AD 275. Rome’s coin had already touched its nadir; what remained was the slow, humiliating end game: Diocletian’s attempted reset in AD 294, the continued shrinking of the money people actually used, and Constantine’s decision around AD 310 to abandon the silver standard altogether and build a new order on gold.
If sterling were simply to follow the denarius’s remaining path, year for year from here, the calendar writes itself. Britain would reach its “Diocletian moment” around 2044. By the early 2060s, the equivalent of Constantine’s solidus, the pound would retain about one per cent of its 1875 purchasing power. By the early 2070s, on this path, today’s pound would have lost its relevance as a store of value altogether. Priced in gold, it is already there.
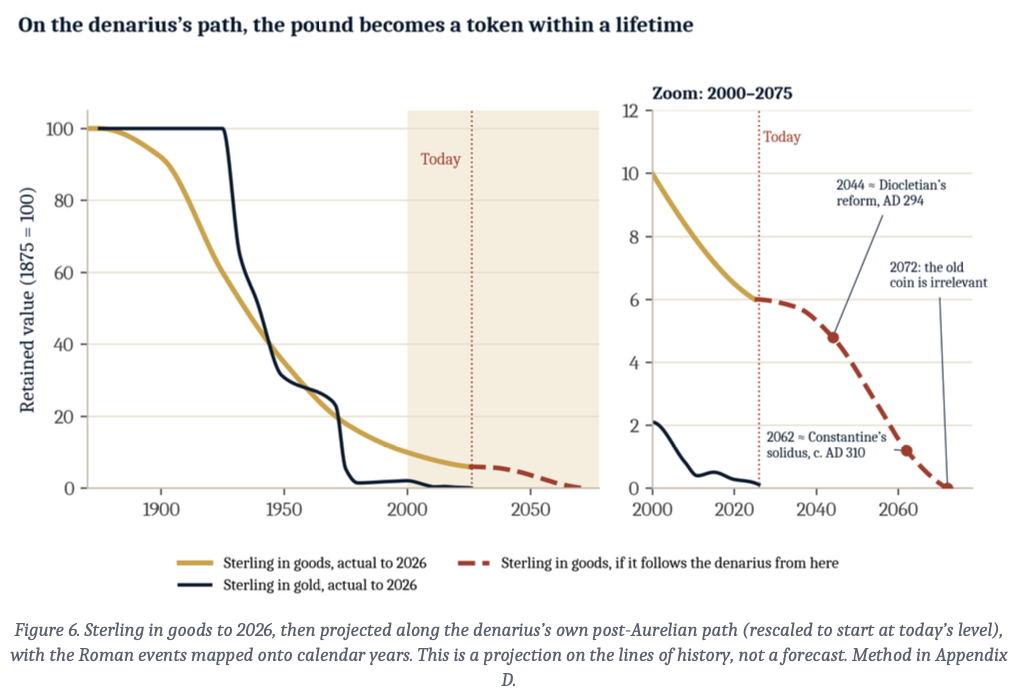
To be clear: this is not a forecast. It is a line drawn along the only complete historical path we have. The point is not the date. The point is that nothing in Britain’s current trajectory bends the line.
If the lines were the only evidence, one might dismiss them as curve-fitting. They are not. The warnings are arriving in plain sight, on both sides of the Atlantic.
On 17 September 2026 the Bank of England stopped selling long-dated gilts. It will now hold £120 billion of bonds maturing after 2049 permanently, and it paused all gilt sales until April 2027, with 30-year borrowing costs at their highest since 1998. The Governor insists the change was planned before the recent turmoil, and perhaps it was.
But when a central bank decides it cannot put its own longest-dated paper back into the market without upsetting it, the message is plain. Britain’s long-dated debt now sits on the central bank’s balance sheet because the market will not absorb it at a price the state can bear. The buyer of last resort for Britain’s long future is no longer the public. It is the Bank.
In Washington, the Treasury is openly debating whether to trim long-dated auctions to keep yields in check. When the two great Anglo-Saxon borrowers both flinch at selling thirty-year paper, the market is telling them what it thinks of the thirty years.
Britain has run a budget deficit every year since 2001–02. Each Budget arrives with a new promise that this tax rise is the last. In November 2024 the Chancellor told MPs there would be no more tax increases this Parliament; a year later the November 2025 Budget raised taxes again, and the next one is already being trailed.
Real pay took some fifteen years merely to regain its 2008 level. The state takes more, the citizen keeps less, and the country gets poorer in real terms while being told it is being made fairer.
Meanwhile the British Army has shrunk below 73,000 regular soldiers, its smallest since the Napoleonic era. The Delhi Police has a sanctioned strength of more than 92,000. The army of a nation more than 160 times Delhi’s area is now smaller than one city’s police force.
Yet the government can announce £340 million for rough sleeping with a flourish, because a compassionate headline wins more votes than a defence budget. Politicians hide behind vote-bank policies because building an army, a runway or a bridge pays off long after the next election and costs them this one.
America is no better, only bigger. Its newest aircraft carrier, the $13 billion USS Gerald R. Ford, came home in May 2026 from the longest carrier deployment since Vietnam, plagued throughout by a sewage system that kept failing; sailors spent the cruise nursing broken toilets. San Francisco once budgeted $1.7 million for a single public toilet.
A canary dying in a coal mine makes no noise. The miners only notice when the singing stops. Britain has stopped listening for the song. It is time to turn the music back up, and to hear what it is saying.
Rome did not fall for want of aqueducts or silver. It passed through civil war, plague, invasion and fiscal exhaustion. But look at the order of events. First the great works thinned out. Then the money rotted. Then the state reorganised itself in desperation: Diocletian’s Tetrarchy, Constantine’s new capital and new gold. And in AD 476 the Western Empire ceased to exist. The East survived only by becoming something else.
The institutional form that built the peak did not survive the descent.
The contrast is the whole lesson. The East did not survive by luck. It anchored itself on an honest gold coin, the solidus, and kept it sound for some seven centuries. And it kept building: the Theodosian Walls of Constantinople went up in a matter of years in the fifth century, and Hagia Sophia in about five.
The half of Rome that kept its money honest and its builders busy lived for another thousand years. The half that did neither did not.
Britain has walked the first two stages of that road. The building curve is two-thirds of its peak and falling. The currency has lost about 94 per cent of its value in goods and more than 99.8 per cent in gold, and is compounding towards the same nothing that the antoninianus reached. The central bank is quietly retreating from its own long-dated debt. These are not forecasts. They are observations.
There is one test left. The UK’s infrastructure pipeline lists 734 projects worth £718 billion. If that money becomes finished bridges, lines and power stations, on time and at sane cost, the curve can still turn.
But nobody who has watched Hammersmith, HS2 or Heathrow should hold their breath. If the pipeline becomes consultations, reviews, re-scopings and doubled estimates, then the problem was never money. It was will. And will, once lost, has almost never been found again by the same civilisation.
I will not pretend the charts are ambiguous. The symptoms are plain. The trend lines are plain. A society that can no longer fight through the small things to build the large ones does not stop being rich overnight, or kind, or clever. It stops being ambitious.
It pays for its kindness with a currency that is quietly worth less every year, until one day it is worth nothing and a new order is built on its remains. The structure it settles into may be socially decent. Over the long run it is fatal.
Civilisations never announce their ending. They hold another meeting, commission another review, and discover that the bridge will cost twice as much. Outside the window in Dubai another tower is rising. In London another consultation has begun. By the time a society notices the missing monument, the monument is the least of what it has lost.
Can it be fixed? Yes — but not by the politics that produced it. It would take a political culture that rewards finishing things rather than objecting to them. Britain has done this before. The question is whether it still wants to.
A curated working sample of 100 major Roman projects — roads, aqueducts, harbours, bridges, walls, forums, baths, amphitheatres, palaces, temples and basilicas — covering 350 BC to AD 450.
Each project is scored 0–100 on four dimensions and averaged:
Engineering difficulty: structural, hydraulic and geotechnical problems relative to the technology of the time.
Physical scale: size, span, length and material intensity.
Logistics: labour, quarrying, transport and sequencing.
Sophistication: integration of functions, precision and services.
For each 50-year period, frontier complexity is the average of the five highest-scoring projects. This measures the edge of demonstrated capability without allowing numerous small works to dominate.
Frequency is the count of qualifying projects, normalised so that the busiest period equals 100.
The weighting leans towards capability, so that neither many modest works nor a single masterpiece defines an era.
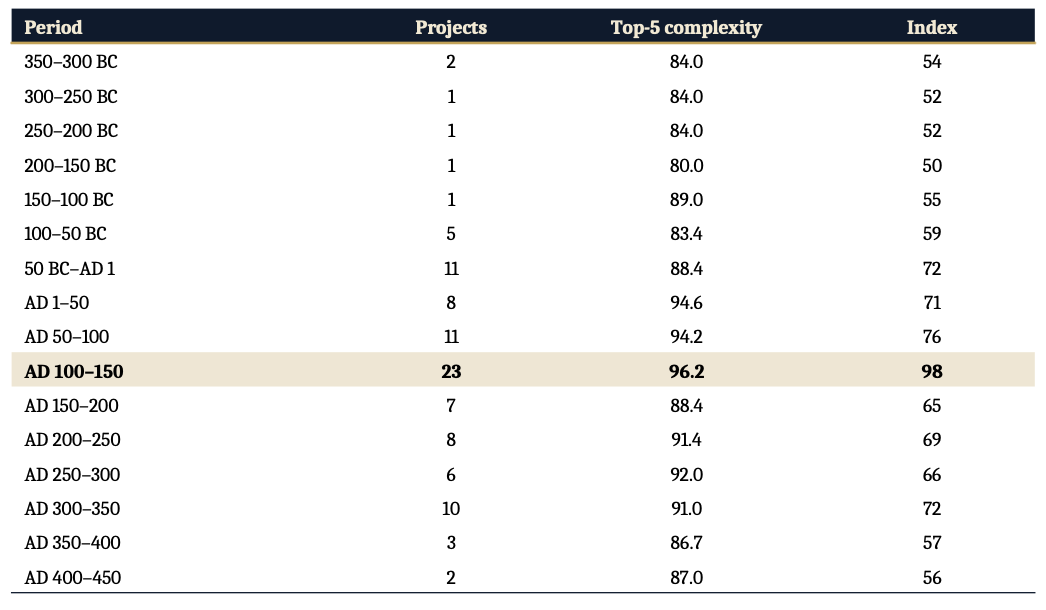
Later Rome keeps a frontier complexity above 91 through AD 300–350; the index falls mainly because the number of qualifying projects falls. Hadrian’s accession (AD 117) is a marker near the crest, not a causal break.
Silver purity: roughly 97–98% under Augustus; gradual decline to about 80% by Marcus Aurelius. The antoninianus, introduced by Caracalla and tariffed at two denarii with far less than twice the silver, fell to around 15% under Valerian and Gallienus and roughly 1–2% under Gallienus alone. Aurelian’s reform around AD 274 was a modest repair; Diocletian replaced the system.
Shipwrecks: counts of Roman-period Mediterranean wrecks per 50 years, normalised. The series is biased by where divers have searched and what survives.
Ice-core lead: Greenland/Antarctic lead deposition, used as a proxy for mining and smelting. It reflects regional, not solely Roman, activity.
None of these measures GDP. Their value is their independence.
A curated 100-project working sample covering canals, railways, tunnels, bridges, ports, sewers, power, roads, airports and other megaprojects, scored on the same four dimensions, with the peak provisionally placed around 1875.
Sterling is shown as domestic purchasing power using the Bank of England long-run price series. This measures inflation, not metallurgical debasement.
Britain was on a gold-linked standard through most of its building age, with convertibility suspended around the First World War and left gold in 1931.
Roman clock: year 0 ≈ AD 125.
Gallienus: c. AD 260–68 ≈ +142.
Aurelian: c. AD 274 ≈ +150.
Diocletian: AD 294 ≈ +169.
Constantine solidus: c. AD 309–312 ≈ +187.
After this point, the silver-washed nummus is no longer a silver standard. Post-Aurelian values are approximate and schematic.
Sterling in gold: £3.89/oz, the Mint price in 1875, against £3,218.50/oz, the LBMA fix on 12 September 2026, gives approximately 0.12% retained.
Intermediate points use approximate annual sterling gold prices, including approximately £12.4 in 1949, £17 in 1971, £262 in 1980 and £1,380 in 2020.
Sensitivity: moving Britain’s peak from 1875 to 1900 puts Britain at +126 years, which aligns with Rome around AD 250, in the heart of the third-century crisis. Because sterling was on gold from 1875 to 1914, the gold measure is unchanged.
The conclusion does not depend on the choice of peak year.
Rome’s silver index from +150 (5) through +169 (4), +180 (2.2), +187 (1) to +197 (0) is rescaled to start at sterling’s 6 in 2026 and mapped year for year from the 1875 clock.
2062: 1.2
2072: nil
These are historical-path illustrations, not forecasts.
Starting from today’s working purchasing-power index of 6:
3% annual inflation: 6 × (1.03)⁻⁵⁰ ≈ 1.4
4% annual inflation: 6 × (1.04)⁻⁵⁰ ≈ 0.84
These are compounding illustrations, not inflation forecasts.
The building continuation in Figure 4 assumes slow erosion rather than collapse, because the UK’s March 2026 pipeline — 734 projects worth £718 billion — is evidence of prospective capacity.
The test is conversion:
Time to completion
Real cost per unit of output
Number of simultaneous major schemes
Both project lists are curated samples, not censuses. Scores are comparative judgements. A fixed 100-project list can bias frequency. Sterling purchasing power is not silver fineness. Shipwreck and ice-core series carry their own biases.
A publication-grade version should publish full inventories and scores, test 25-, 50- and 75-year windows and alternative weights, and replace schematic monetary curves with source-level series.
Peak alignment is an analytical device. It places Britain near Rome’s third-century stage but predicts no date or form of outcome.
Historic England; TfL and London Assembly (Hammersmith Bridge); State Council of China; HZMB Authority; China Railway Group (Hangzhou Bay, HZMB); Maryland Transportation Authority (Key Bridge); UK Department for Transport (Heathrow); India PIB and Ministry of Civil Aviation (airports); HS2 Ltd, November 2024 (bat structure); House of Lords oral evidence, 10 September 2026 (Defra).
Parco archeologico del Colosseo; English Heritage; UNESCO; The National Archives (Victorian railways); Bank of England (inflation calculator); UK Government infrastructure pipeline, March 2026; Bank of England Asset Purchase Facility market notice, 17 September 2026.
Britain Remade, August 2023; UK Government HS2 six-monthly report, May 2026; LBMA gold fix via Eastern Herald, 13 September 2026; Bloomberg, 7 August 2026.
Chartered Institute of Taxation, November 2024; UK Ministry of Defence personnel statistics; Ministry of Home Affairs, Rajya Sabha reply, December 2025; NPR / NEPM, 2026; City of San Francisco, 2022.
Metropolitan Museum of Art; Cambridge Ancient History; Cambridge Encyclopaedia of Late Antique Art and Archaeology (2025); Journal of Roman Archaeology.