
Butter Chicken Doesn’t Help Lose Weight : Vikas Sehgal

Vasuki Perspectives · Notes on Money & Motive Butter Chicken Doesn’t Help Lose Weight by Vikas Sehgal The other evening, I had dinner near Mumbai airport before catching my flight home. Whenever I am in Mumbai, I make sure I see him for dinner — and he has a remarkable habit of asking questions that stay with me long after the meal is over. This essay is the result of one of those questions. As a good Punjabi, I was enthusiastically demolishing butter chicken with naan. As a good Gujarati observing Ekadashi, he was perfectly content with fruit and a cold coffee. I happen to be on a determined mission to lose weight. He, rather annoyingly, has already succeeded. That evening, two things wanted to happen. I wanted to lose weight. India wanted more foreign investment. Neither, I suspected, was going to happen without changing course in a dramatic way. As I reached for another piece of naan, our conversation drifted to the Federal Reserve, the rupee and the surprisingly modest flow of foreign portfolio investment into India. Somewhere between the butter chicken and his fruit plate, it struck me that my dinner and India’s investment policy suffered from exactly the same problem. Both had admirable intentions. Neither had aligned its actions with those intentions. Businesses create wealth. Policy determines how much of that wealth survives the journey back to its owners. Where did the ₹20 go? Illustrative economic journey, ₹100 invested Value Initial investment ₹100 Value after one year ₹120 Less: corporate tax −₹5 Less: dividend tax −₹6 Less: INR vs USD (illus.) −₹5 Less: USD vs gold (illus.) −₹8 Real value retained ₹96 Not an accounting statement — an illustration of how successive policy leakages erode the real value a foreign investor ultimately retains. Same ₹100, different choices Route After 1 yr Indian company ₹96 GoI security (6%) ₹106 USD FCNR deposit (6%) US$106 The state seeks foreign capital for enterprise while offering sovereign alternatives that compete for the same capital — financing itself with the very flows it says it wants private business to receive. “Capital has no passport, no ideology and no sentiment. It simply follows incentives.” The irony is that the Indian state both seeks foreign capital for enterprise and offers attractive sovereign alternatives that compete for the same capital. In effect, it is consuming the very foreign capital it says it wants private enterprise to receive, while incentivising investors to finance the sovereign instead. As I drove alone to the airport after dinner, I found myself smiling. Judging by the amount of butter chicken and naan I had just consumed, my prospects of losing weight had not improved in the slightest. Wanting to lose weight is not a diet. Wanting foreign investment is not an investment policy. Intentions define the destination. Actions determine whether we ever arrive. Life has a peculiar way of rewarding what we do, not what we wish for. Neither markets nor waistlines negotiate with good intentions. They respond to incentives, discipline and consistent action. Unfortunately, butter chicken and naan have never been part of a successful weight-loss strategy. Perhaps investment policy isn’t very different. VASUKI FUNDS Vasukixvi@vasukiindia.Com Disclaimer This article is published for informational purposes only and does not constitute investment advice or analysis. The information presented has been sourced from public domains and has not been independently verified. Vasuki Group makes no representations or warranties regarding the accuracy, completeness, timeliness, or reliability of the content. Neither Vasuki Group nor its affiliates, directors, employees, or representatives shall be liable for any errors, omissions, or reliance on the information provided. This article does not constitute an offer, solicitation, or recommendation for any investment, securities transaction, or contractual engagement. Readers should conduct their own due diligence before making any financial decisions. Any views expressed are those of the author and do not necessarily reflect the opinions of Vasuki Group. Further, Vasuki Group may hold or take positions in the market that differ from the views expressed in this article. All rights reserved. Vasuki Group reserves the right to update or modify this article at its discretion. For more information, reach out to us on research@vasukiindia.com.
The Arithmetic of Wealth : Vikas Sehgal

The Arithmetic of Wealth · Vasuki Perspectives VASUKI PERSPECTIVES FINANCE · WEALTH PRESERVATION The Arithmetic of Wealth The Journey of ₹100: Where Wealth Disappears By Vikas Sehgal Imagine two investors, each beginning with exactly ₹100. Both are intelligent. Both are disciplined. Both select excellent businesses. Twenty years later, one has preserved significantly more purchasing power than the other. The difference was not the stock they selected. The difference was the journey that the ₹100 took before it finally reached them. This framework is intentionally simplified. It is not an accounting exercise or a tax guide, nor is it intended to predict investment returns in different markets. Its purpose is to illustrate a broader economic principle: the cumulative effect of layers of value extraction on long-term investor wealth. Every economy imposes friction on capital through taxation, regulation, compliance costs, transaction costs, inflation and currency movements. Individually, each layer appears manageable. Collectively, they determine how much purchasing power ultimately belongs to the investor. The question therefore is not simply, “How much did my investment earn?” The more important question is: “After every layer of value extraction has taken its share, how much of my original purchasing power remains?” Journey of ₹100 India US UK Singapore Dubai Initial investment 100 100 100 100 100 After remittance costs 100 98 98 98 98 After corporate taxes & institutional costs 60 72 70 74 80 After investor-level taxes 26 40 38 42 48 ₹100 remaining after all frictions 18 32 30 28 35 *Illustrative values intended to demonstrate cumulative structural friction rather than statutory tax calculations. The table is not intended to compare expected market performance. Rather, it illustrates a simple but frequently overlooked reality: an investor never owns only the underlying business. The investor also owns the legal framework, the tax regime, the currency, the regulatory environment and the institutional incentives embedded within the jurisdiction where that capital resides. This explains why the relevant question is not simply, “Which stock will produce the highest return?” A more important question is, “How much of that return will ultimately remain in my hands after every layer of value extraction has taken its share?” Perhaps this also explains one of India’s oldest investment habits. For generations, Indian households quietly accumulated gold instead of financial assets. Whether by instinct or experience, they understood a timeless principle: the fewer intermediaries standing between you and your wealth, the fewer opportunities there are for value to be extracted before it reaches you. Investors spend enormous effort selecting the right company. They analyze management quality, competitive positioning, earnings growth and valuation. Far fewer spend equal time studying the economic system through which those returns must travel before the wealth finally reaches them. Yet, over decades, the system can matter as much as the investment itself. Stock selection determines relative performance within a market. The choice of jurisdiction determines the structural environment within which every investment compounds. A great company can outperform its peers. A great system allows that outperformance to reach the shareholder. For the global investor, therefore, the first question is not: “Which company should I own?” It is: “Which system should my capital live in?” Every investor begins with the same ₹100. The difference is not where the journey starts. The difference is how much of that ₹100 is still yours when the journey ends. Disclaimer This article is published for informational purposes only and does not constitute investment advice or analysis. The information presented has been sourced from public domains and has not been independently verified. Vasuki Group makes no representations or warranties regarding the accuracy, completeness, timeliness, or reliability of the content. Neither Vasuki Group nor its affiliates, directors, employees, or representatives shall be liable for any errors, omissions, or reliance on the information provided. This article does not constitute an offer, solicitation, or recommendation for any investment, securities transaction, or contractual engagement. Readers should conduct their own due diligence before making any financial decisions. Any views expressed are those of the author and do not necessarily reflect the opinions of Vasuki Group. Further, Vasuki Group may hold or take positions in the market that differ from the views expressed in this article. All rights reserved. Vasuki Group reserves the right to update or modify this article at its discretion. For more information, reach out to us on research@vasukiindia.com.
My Mother’s Pressure Cooker : Vikas Sehgal

My Mother’s Pressure Cooker · Vasuki Perspectives VASUKI PERSPECTIVES CURRENCY · FISCAL POLICY My Mother’s Pressure Cooker Why the Rupee May Be India’s Fiscal Safety Valve By Vikas Sehgal When I was a child, I was terrified of my mother’s pressure cooker. Every time it let out a loud whistle, I instinctively thought it was about to explode. Years later, I learnt that the whistle meant exactly the opposite. It wasn’t a warning of failure—it was the mechanism that prevented one. Today, I think about the Indian rupee in much the same way. The debate around the Indian rupee is often framed around exports, imports and capital flows. I believe the more important driver over the coming decade will be fiscal arithmetic. Investors often analyse a currency through the lens of trade balances and interest-rate differentials. I believe they should first analyse the sovereign balance sheet and the political incentives that shape it. India has accumulated a large stock of rupee-denominated obligations through subsidies, free food programmes, welfare schemes such as Ladli Behna, pensions and other social commitments. As these commitments become politically difficult to reverse, they increasingly resemble long-duration liabilities on the sovereign balance sheet. These promises are liabilities in the state’s own currency. History suggests that governments with liabilities denominated primarily in their own currency rarely default outright. Instead, they reduce the real value of those obligations through inflation and gradual currency depreciation. Inflation allows the state to remain politically popular while becoming progressively less liable in real terms. For politicians, this creates a powerful incentive. They can make generous promises, deliver them in nominal terms, and yet gradually reduce their real economic cost through inflation. Investors should think carefully about the long-term implications of this dynamic. I therefore believe it is in the long-term fiscal interest of the Indian state for the rupee to depreciate steadily against the US dollar—and even more rapidly against gold. In a democracy where political incentives increasingly favour expanding welfare commitments, currency depreciation becomes the pressure-release valve that allows those promises to be honoured in nominal terms while reducing their real economic cost over time. The obvious counterargument is that a weaker rupee makes imports more expensive. While this is true in principle, India’s primary external vulnerability is oil. Other imports, such as fertilizers and industrial inputs, are comparatively manageable. More importantly, I believe the medium-term outlook for oil prices is structurally lower as significant new supply from South America enters global markets. If oil trends towards US$50 per barrel, India gains the rare opportunity to allow a weaker currency without importing the same degree of inflation that would normally accompany such depreciation. Ironically, a stronger rupee could make India’s fiscal position more difficult. Currency appreciation increases the real value of the government’s rupee-denominated obligations, making an already large fiscal burden even harder to manage. When one looks beyond the Central Government and includes the liabilities of highly indebted states such as Punjab, West Bengal and Kerala, India’s consolidated public-sector debt is considerably higher than headline figures suggest. The rupee should not be viewed merely as an exchange rate. It is a fiscal adjustment mechanism. Like the whistle on my mother’s pressure cooker, gradual currency depreciation releases pressure that would otherwise continue to build within the sovereign balance sheet. Without that safety valve, the adjustment eventually has to come through painful fiscal reforms, significantly higher taxation, much slower growth, or, in the extreme, a fiscal crisis. For that reason, I expect the rupee to depreciate not only against the US dollar, but even more persistently against gold. Gold measures the long-term erosion of purchasing power; the dollar merely measures the value of one fiat currency against another. Fiscal arithmetic cannot be negotiated—it merely reasserts itself over time. Disclaimer This article is published for informational purposes only and does not constitute investment advice or analysis. The information presented has been sourced from public domains and has not been independently verified. Vasuki Group makes no representations or warranties regarding the accuracy, completeness, timeliness, or reliability of the content. Neither Vasuki Group nor its affiliates, directors, employees, or representatives shall be liable for any errors, omissions, or reliance on the information provided. This article does not constitute an offer, solicitation, or recommendation for any investment, securities transaction, or contractual engagement. Readers should conduct their own due diligence before making any financial decisions. Any views expressed are those of the author and do not necessarily reflect the opinions of Vasuki Group. Further, Vasuki Group may hold or take positions in the market that differ from the views expressed in this article. All rights reserved. Vasuki Group reserves the right to update or modify this article at its discretion. For more information, reach out to us on research@vasukiindia.com.
Remember the Athenians : Vikas Sehgal
Remember the Athenians Remember the Athenians Great Powers Don’t Forget, Rarely Forgive By Vikas Sehgal Let me begin with a disclaimer. I am not predicting the destruction of Iran. I am not claiming that war is inevitable, nor am I arguing that history repeats itself with mechanical precision. What I am describing is a possibility. More accurately, it is a pattern. A pattern that appears frequently enough throughout history that it deserves consideration, particularly at moments when public attention is focused almost entirely on the immediate present. Imagine yourself standing in the palace complex at Persepolis. Dawn light filters through towering columns adorned with carvings of conquered nations bringing tribute to the Great King. Courtiers move quietly through corridors that serve the largest empire on earth. Before Darius I rises from his bed, before ambassadors arrive from distant provinces and generals report from the empire’s frontiers, a servant whispers a simple phrase into the ruler’s ear: “Master, remember the Athenians.” The reference was to Marathon. To modern readers the phrase may appear trivial, but to Darius it carried immense significance. This was not the ruler of a small kingdom nursing a local grievance. This was the master of an empire stretching from Egypt to India, commanding wealth, manpower, and resources on a scale that the Greek city-states could scarcely comprehend. Yet despite that overwhelming superiority, a small collection of Greeks had humiliated him. The reminder was not merely about revenge. It was about memory. Darius understood something that modern analysts often forget. Great powers can survive defeat. They can survive embarrassment. They can survive tactical setbacks. What they struggle to tolerate is allowing those setbacks to become accepted facts. An unanswered humiliation invites repetition. A setback ignored becomes a precedent. A precedent becomes an invitation for further challenge. Persia remembered Marathon not because it changed the balance of power, but because it challenged the perception of power. Persia returned. The defeat was neither forgotten nor accepted. Years later, Xerxes crossed into Greece with one of the largest military expeditions the ancient world had ever seen. The campaigns that followed would ultimately culminate in one of history’s enduring lessons: powerful states may absorb defeat, but they rarely stop thinking about it. Eventually Athens itself would watch its city burn. History contains countless variations of this story. The names change. The geography changes. The technologies change. Human nature does not. Consider Rome after Cannae. In 216 BC Hannibal inflicted one of the most devastating defeats in military history. Tens of thousands of Roman soldiers died in a single day. Entire aristocratic families disappeared on the battlefield. The Republic lost officers, senators, commanders, and citizens on a scale almost impossible to comprehend. Many contemporary observers believed Rome was finished. Rome reached a different conclusion. Instead of negotiating from weakness, Rome absorbed the lesson. It rebuilt its armies, revised its military doctrine, replaced commanders, and fundamentally altered its strategy. Rome understood something that many modern observers struggle to appreciate: battlefield defeats do not necessarily determine the outcome of wars. The willingness to learn from defeat often matters more than the defeat itself. Years later Rome carried the war into Africa. Hannibal was defeated at Zama. Carthage survived temporarily, but Roman memory endured long after the immediate danger had passed. Roman statesmen increasingly embraced a phrase that would echo through history: Carthago delenda est—Carthage must be destroyed. The phrase was less a military objective than a mindset. Rome no longer viewed Carthage as a competitor to be managed. It viewed Carthage as a problem to be eliminated. Eventually it was. The city was destroyed. Its political independence disappeared. Its empire vanished. Its territory was absorbed into Roman control. Whether or not every legend surrounding the destruction is literally true is beside the point. The strategic reality is undeniable. Rome remembered. Rome returned. Rome finished the problem. The same pattern appears in ancient China. Most people know Qin as the state that unified China under Qin Shi Huang. Fewer appreciate how formidable its opponents were. Among them, Chu stood apart. Chu possessed vast territory, abundant agricultural resources, enormous manpower, and a military establishment capable of challenging any rival in the Warring States era. For long periods, Chu appeared every bit as powerful as Qin. The struggle between Qin and Chu was neither quick nor inevitable. Qin suffered reverses. Campaigns failed. Commanders underestimated their opponent. Yet Qin possessed advantages that were not immediately visible on the battlefield. It possessed administrative discipline, institutional capacity, centralized authority, and a political culture obsessed with learning and adaptation. Rather than accepting setbacks, Qin treated them as information. Larger armies were mobilized. Command structures were revised. Strategies were adjusted. Lessons were incorporated. Qin returned repeatedly until the outcome changed. When the struggle finally ended, Qin unified China while Chu disappeared as an independent state. Once again the lesson was not that great powers never lose. The lesson was that they often learn faster than their rivals. Modern history offers similar examples. Russia’s experience in Chechnya illustrates the same phenomenon. The First Chechen War exposed profound weaknesses within the Russian military. Moscow suffered embarrassment, operational failures, and strategic disappointment. Many observers interpreted the outcome as evidence of permanent Russian decline. Russia interpreted it differently. Russian planners studied what had gone wrong. Military structures were revised. Tactics evolved. Resources were concentrated. Years later Russia returned under dramatically different circumstances. The Second Chechen War produced a very different outcome. Grozny was reduced to ruins. Entire districts became symbols of devastation. Whatever moral judgments one attaches to the conflict, the strategic conclusion remains difficult to dispute. Russia did not accept humiliation. It absorbed the lesson and came back with overwhelming force. The common thread connecting Persia, Rome, Qin, and Russia is not invincibility. None of these powers were invulnerable. None were immune from mistakes. All suffered defeats. All experienced setbacks. The common thread is persistence. This distinction matters because modern observers often confuse tactical outcomes with strategic conclusions. A withdrawal is interpreted as acceptance. Restraint
The Slush Phase of the Global Monetary Order : Vikas Sehgal
The Slush Phase of the Global Monetary Order The old system still trades. The new system is already being priced. By Vikas Sehgal When matter changes state, it does not move cleanly from one form to another. Water does not instantly become ice. For a period, it becomes slush — partly liquid, partly solid, carrying the properties of both states. That is where the global monetary system is today. The old dollar-reserve order has not died. But the new order has not fully formed. Markets are stuck between two regimes: the Treasury-centered world of the past and a more fragmented, gold-sensitive, multi-currency world that is beginning to emerge. History shows that monetary systems often outlive the powers that created them. Rome declined, but Roman monetary habits survived for centuries. The denarius lived on in later coinage and language; the word “dinar” descends from it. The dirham, rooted in the older drachma tradition, carried forward another ancient monetary inheritance into the Middle East. A dead empire can still have a living currency. That is the point about the dollar today. Even if the American-led order is weakening, the dollar will not vanish overnight. It remains embedded in trade contracts, central-bank reserves, debt markets, commodity pricing, and institutional memory. The old system can be politically exhausted and still financially alive. Under the old regime, the market reaction to war was simple. Geopolitical stress meant the dollar strengthened, Treasuries rallied, yields fell, and gold rose. The dollar was the refuge. Treasuries were the safe asset. Gold was the insurance policy. Today the signals are no longer clean. Yields can rise even when fear rises. Treasuries can sell off even when geopolitical risk increases. Gold can fall tactically even as its strategic role strengthens. The dollar can weaken without collapsing. That is not irrationality. It is transition. The United States remains the center of the financial system, but it is no longer seen as the neutral custodian of that system. China is rising, but it has not built a trusted alternative. Europe is strategically lost. The rest of the world is diversifying, hedging, and recalibrating. This is the Thucydides problem expressed through currencies, bonds, and gold. The incumbent is no longer trusted enough to dominate unquestioned. The challenger is not yet trusted enough to replace it. The result is not a clean handover. It is contradictory pricing. In the old stable state, the dollar was the reserve asset, Treasuries were the safe asset, and gold was the hedge. In the next stable state, the dollar may remain important, but not supreme. Treasuries may retain nominal value, but lose real reserve privilege. Gold may become a core neutral asset on sovereign balance sheets. The world may move toward a multi-currency system built around dollars, gold, commodities, regional currencies, and bilateral settlement. The market is not confused. It is changing state. We are in the slush phase of the global monetary order. The old system still trades. The new system is already being priced. Disclaimer This article is published for informational purposes only and does not constitute investment advice or analysis. The information presented has been sourced from public domains and has not been independently verified. Vasuki Group makes no representations or warranties regarding the accuracy, completeness, timeliness, or reliability of the content. Neither Vasuki Group nor its affiliates, directors, employees, or representatives shall be liable for any errors, omissions, or reliance on the information provided. This article does not constitute an offer, solicitation, or recommendation for any investment, securities transaction, or contractual engagement. Readers should conduct their own due diligence before making any financial decisions. Any views expressed are those of the author and do not necessarily reflect the opinions of Vasuki Group. Further, Vasuki Group may hold or take positions in the market that differ from the views expressed in this article. All rights reserved. Vasuki Group reserves the right to update or modify this article at its discretion. For more information, reach out to us on research@vasukiindia.com.
India’s Market Is Warning About Lower Growth : Vikas Sehgal

India’s Market Is Warning About Lower Growth The market is pricing a tougher future. Policy must deliver a stronger one. By Vikas Sehgal At current levels, India’s stock market is no longer pricing a cheap growth story. It is pricing a more difficult reality: India may be at risk of becoming a lower-growth economy. The market is not saying India will grow at 7–8% real GDP forever. It appears to be pricing something closer to a 5–6% real growth economy — still respectable, but no longer exceptional enough to justify complacency. That is the warning. Note: China adjusted = mainland China + Hong Kong market cap, to capture Chinese companies listed outside the mainland. India cannot afford to let its growth premium erode. If the government wants to protect that premium, it has to loosen the constraints on growth. That means reducing fiscal wastage, improving the quality of public spending, accelerating infrastructure execution, lowering friction for private investment, easing the burden on businesses, and allowing more capital to flow into productive sectors. India does not need more headline spending. It needs better spending. The risk is that too much fiscal capacity is absorbed by subsidies, bureaucracy, leakage, and low-return expenditure, while too little goes into productivity, logistics, manufacturing depth, energy security, and private-sector confidence. If that continues, India’s growth ceiling will fall. And the market is already beginning to price that risk. The market is giving India a warning, not a guarantee. Disclaimer This article is published for informational purposes only and does not constitute investment advice or analysis. The information presented has been sourced from public domains and has not been independently verified. Vasuki Group makes no representations or warranties regarding the accuracy, completeness, timeliness, or reliability of the content. Neither Vasuki Group nor its affiliates, directors, employees, or representatives shall be liable for any errors, omissions, or reliance on the information provided. This article does not constitute an offer, solicitation, or recommendation for any investment, securities transaction, or contractual engagement. Readers should conduct their own due diligence before making any financial decisions. Any views expressed are those of the author and do not necessarily reflect the opinions of Vasuki Group. Further, Vasuki Group may hold or take positions in the market that differ from the views expressed in this article. All rights reserved. Vasuki Group reserves the right to update or modify this article at its discretion. For more information, reach out to us on research@vasukiindia.com.
Finish What You Start : Vikas Sehgal , Nishant Jain

Finish What You Start — The American Dilemma Understanding the problem and acting on it are two different things. By Vikas Sehgal, Nishant Jain Some of the sharpest strategic insights I’ve heard have not come from boardrooms or books — but over good food, from a man whose life has been anything but stable. A good friend of mine from Mathura — someone I admire deeply — Mr. D, has lived through more upheaval than most, and I’ve noticed that his clearest thinking tends to surface in the most unassuming settings. One such afternoon, over lunch at a small South Indian restaurant in Borivali, in North Mumbai, he delivered a long, almost theatrical explanation of his high blood sugar — what he couldn’t eat, what he shouldn’t eat, what the doctor had forbidden, what discipline demanded. It was precise, clinical, and entirely convincing. And then, without pause, he ordered dessert. Not something symbolic, but a full, unapologetic indulgence. I looked at him, amused. He smiled. “Understanding the problem and acting on it are two different things.” Then his tone shifted, and the conversation moved from sugar to something far more consequential. He spoke of the Brahmins of Mathura who chose defiance when faced with Mughal force, fully aware of the cost, because once the moment arrived, the choice was no longer theoretical — it was existential. And then of Hindu kings who, at decisive moments, chose restraint when force was required — not out of weakness, but out of misplaced virtue. “They were not wrong in values,” he said quietly. “They were wrong in timing.” That distinction reveals something modern states still struggle to accept: power is not persuasion; power is imposition. Once invoked — especially military power — the logic becomes brutally simple: you must win, and you must win decisively. Not because brutality is desirable, but because incomplete force is more destructive than decisive force. A war half-fought is not a restrained war — it is a war paid for twice. Before force is used, everything is open to debate — morality, legality, proportionality, long-term consequences. That is where contemplation belongs. But once the first strike is made, the nature of the problem changes. You don’t get to revisit the decision in parts or calibrate resolve in installments. You don’t get two decisions in war. The question is no longer whether to act; it becomes whether you are willing to finish what you have already started. History is unforgiving on this point. Hannibal Barca, after Cannae, had Rome exposed in a way few armies ever have. This was not a moment for brilliance; it was a moment for completion. Yet back home, caution emerged dressed as prudence. Arguments for restraint, for calibration, for limiting exposure began to dominate. Support slowed, commitment fragmented. It did not look reckless; it looked responsible. But every system produces this instinct — voices that appear measured and morally grounded, yet at the point of execution fracture resolve just enough to change the outcome. In war, that fracture is fatal. The enemy is given time, and time is the only resource a wounded system needs to recover. Rome did exactly that. It adapted, reorganised, and ultimately destroyed Carthage — not because it was stronger at the beginning, but because it was more decisive at the end. History does not reward restraint in the middle of execution — it punishes it. Hanno was not irrational. He represented a familiar instinct within political systems — the desire to limit exposure, to question escalation, to avoid overcommitment to a single path. His arguments would have sounded responsible, even principled. And that is precisely why they were effective. Every system produces its version of Hanno — figures who, at the moment of execution, fragment resolve in the name of prudence. They rarely see themselves as obstructing victory; they see themselves as preventing excess. But in war, that distinction collapses. Because hesitation at the point of advantage does not moderate outcomes — it alters them. The names change. The instinct does not. The pattern repeats. Prithviraj Chauhan defeated Muhammad Ghori in the First Battle of Tarain and had both advantage and initiative. What followed was restraint where resolution was required. Within a year, the outcome reversed, and with it, the trajectory of the subcontinent. Even advanced political systems fall into the same trap. Athens, during the Peloponnesian War, allowed internal pressures to override external necessity and recalled Alcibiades mid-campaign. The war did not pause; only Athens’ coherence did. The result was not moral credibility but strategic erosion. Once force is engaged, politics does not disappear — but if politics begins to dictate hesitation, the outcome is rarely stability. It is failure, only deferred. Because adversaries do not interpret partial force as restraint; they interpret it as hesitation, and hesitation is not neutral — it is an invitation. The most dangerous moment in conflict is not escalation — it is the illusion that one can pause without consequence. That was Mr. D’s real point. “Contemplation is a luxury before war,” he said. “Indulgence during it.” This is not a comfortable argument to make, and it is not one that many would have supported at the outset. I may be wrong on the specifics of this conflict. But the pattern itself is not new — and it is rarely forgiving. A decisive outcome will not be clean. It will involve loss of life, destruction, and consequences that cannot be reversed. There will be images that are difficult to justify and decisions that will be criticised for decades. The United States may well be wrong in how it arrived at confrontation with Iran — strategically, politically, even morally. The objectives may have been unclear, the escalation poorly framed, the endgame undefined. Those criticisms are valid, but they are no longer decisive. Because the moment force is used, the nature of the decision changes. This is not an argument for war. War is destruction, loss, and irreversible cost. It should always be
Gulf on the Edge : Vikas Sehgal, Saurav Agarwal
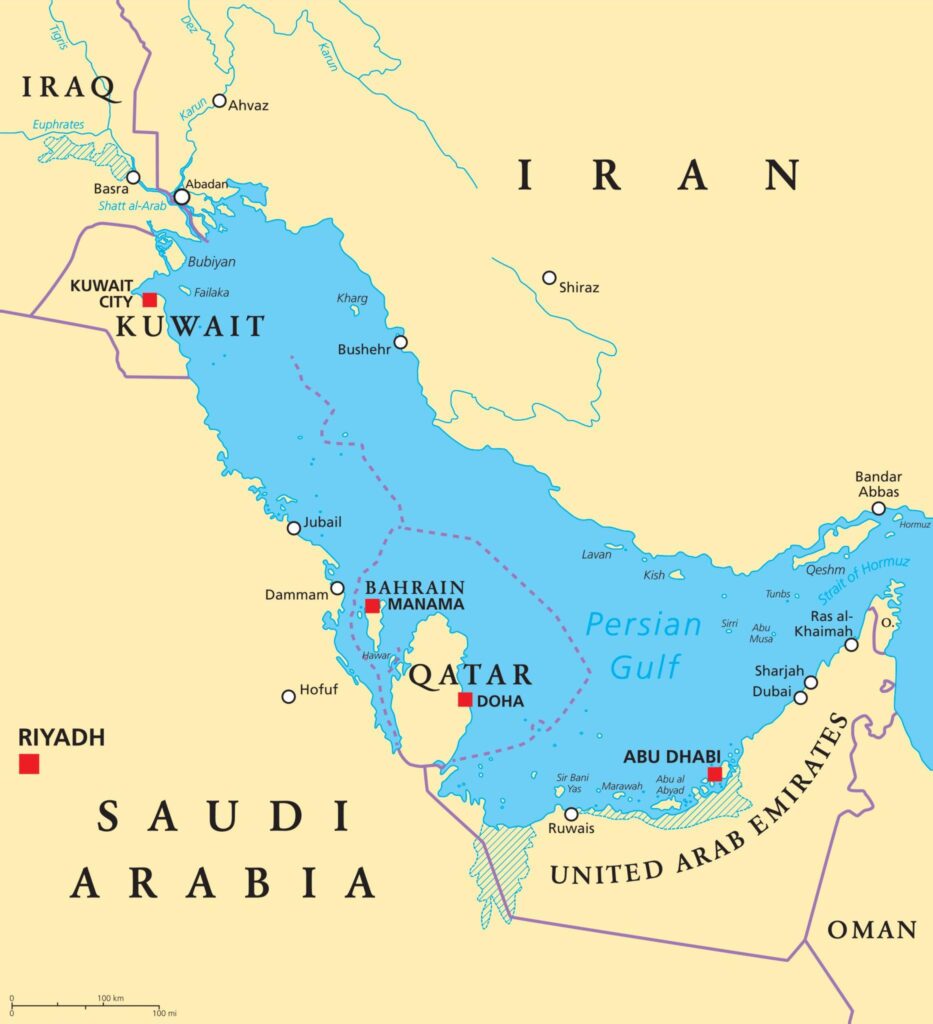
Gulf on the Edge: Why UAE Will Survive While Others Falter Gulf on the Edge: Why UAE Will Survive While Others Falter The Persian Gulf sits at the centre of global energy, finance, and geopolitics. Its oil powers economies across Asia, Europe, and the United States. Its sovereign wealth funds anchor financial markets. Its strategic location underpins US and allied military strategy. Yet beneath the gleaming skylines and enormous wealth lies a sobering reality: not all Gulf states are equally prepared for crisis. The UAE stands apart as resilient, diversified, and forward-looking. Bahrain, Qatar, and Kuwait, by contrast, face structural vulnerabilities that could trigger economic and social turmoil. Hormuz: The Strait that rules their fate The Strait of Hormuz is a chokepoint that defines Gulf vulnerability. Roughly 20% of global oil passes through this narrow passage. If exports are blocked, essential imports—particularly food—cannot arrive. The irony is stark: the Gulf, rich in hydrocarbons, is heavily import-dependent for basic goods. Iran, by contrast, is largely self-sufficient. Its energy, agricultural base, and domestic production allow it to endure shocks that would devastate smaller Gulf states. Rapid population growth, urbanization, and water scarcity in Bahrain, Qatar, and Kuwait magnify the impact of any disruption. Even a temporary blockade could create shortages and social unrest within weeks. The UAE, with advanced logistics, diversified import sources, and substantial reserves, is better positioned to manage such disruptions. Its infrastructure and strategic foresight provide a buffer that its neighbours lack. Economic Fragility: Wealth Is Not Immunity History shows that even small financial shocks can trigger massive systemic collapse. In the 2008 US mortgage crisis, less than 2% of homeowners defaulted, yet it nearly brought the global economy to its knees. The Gulf is even more sensitive. Its wealth, real estate markets, and sovereign funds rely on continuous confidence and capital mobility. If just 5% of expatriates or investors lose trust, it could trigger cascading failures: real estate prices collapse, capital leaves, and local banks face liquidity crises. The UAE’s sovereign reserves ($100B), diversified investments, and conservative fiscal policies give it a cushion. Smaller states—Bahrain ($36B), Qatar ($335B but highly concentrated), and Kuwait ($750B but with high per-capita expectations)—are far more exposed to even minor shocks. Dollar Pegs, Treasuries, and Global Interdependence The Gulf’s currencies are pegged to the US dollar, supported by massive investments in US Treasuries. But global forces strain this system: • China and India already hold substantial US debt, limiting Gulf purchases. • Europe faces its own fiscal deficits. • Korea and other defence-dependent states must redirect capital elsewhere, selling treasuries. If Gulf states cannot continue buying Treasuries, only leveraged hedge funds remain to absorb debt—a form of modern money printing. The result: potential dollar weakness, making currency pegs unsustainable. UAE’s diversified reserves give it flexibility to manage these pressures, but smaller states lack this buffer. US Policy: Rational for America, Risky for Allies The United States cannot indefinitely act as global reserve currency issuer while running massive deficits and deindustrializing its economy. Domestic priorities are shifting. For Gulf states, this creates a dilemma: the reliability of US naval protection, energy transit, and the petro-dollar system is no longer guaranteed. UAE’s prudent investments and independent planning reduce its exposure. Smaller emirates, heavily dependent on US guarantees, face an acute risk if Washington cannot maintain its presence. Historical Lessons: Allies Suffer When Powers Decline History offers cautionary examples of dependent states suffering when dominant powers falter: Rome: Economic and military decline led to abandonment of Britain and distant provinces, creating centuries of instability. Alexander’s Empire: Greek settlements in Central Asia were left marooned after his death, quickly losing political and economic viability. Hellenistic Cities of Asia Minor: Reliant on Greek support, they declined rapidly as central authority weakened. Mughal India: Regional vassals collapsed or realigned when the central economic base weakened. The lesson is clear: dependency magnifies vulnerability. For the Gulf, reliance on US protection, global finance, and energy markets means smaller states are highly exposed to systemic shocks. Why the UAE Stands Out Among Gulf states, the UAE’s approach is markedly different: Diversified economy: Energy contributes a smaller share of GDP than in neighboring emirates. Sovereign reserves: Significant assets provide a buffer against economic shocks. Strategic planning: Investments in logistics, tech, and alternative energy reduce dependence on single points of failure. Resilient institutions: Governance, rule of law, and regulatory frameworks instill confidence in investors. These factors make the UAE far more capable of surviving energy chokepoints, dollar volatility, or regional conflicts. Dark Prospects for Smaller Emirates Bahrain, Qatar, and Kuwait face multiple vulnerabilities: • High dependence on oil revenue and single-sector wealth • Smaller fiscal reserves relative to population and liabilities • Heavy reliance on expatriate labor, making even minor capital flight critical • Exposure to US protection and global financial flows Even minor disruptions—5% exodus of professionals, a temporary Hormuz blockade, or treasury market instability—could trigger cascading crises affecting real estate, sovereign wealth, and social stability. Entering an Uncharted Era The Gulf’s current stability masks underlying fragility. Strategic chokepoints, demographic pressures, financial interdependence, and reliance on external powers create a perfect storm. The UAE’s foresight and resilience position it to survive and adapt. Smaller emirates may not be so lucky. As global powers recalibrate, domestic priorities shift, and geopolitical tensions rise, the Gulf’s structural vulnerabilities are no longer theoretical—they are imminent and systemic. The UAE will likely weather the storm. Its neighbors face an uncertain, potentially dark future. Disclaimer This article is published for informational purposes only and does not constitute investment advice or analysis. The information presented has been sourced from public domains and has not been independently verified. Vasuki Group makes no representations or warranties regarding the accuracy, completeness, timeliness, or reliability of the content. Neither Vasuki Group nor its affiliates, directors, employees, or representatives shall be liable for any errors, omissions, or reliance on the information provided. This article does not constitute an offer, solicitation, or recommendation for any investment, securities transaction, or contractual engagement. Readers should conduct their
When Governments Run Out of Money : Vikas Sehgal, Saurav Agarwal

When Governments Run Out of Money… They Come for Your Gold. When Governments Run Out of Money… They Come for Your Gold. Every financial crisis eventually becomes a political one. At first, the problem appears technical — deficits, borrowing, monetary policy, temporary instability. Governments reassure the public that reforms are coming. Committees are formed. Experts debate solutions. But when the treasury finally empties and the options narrow, the problem becomes brutally simple. The state must find money. At that moment, the definition of wealth quietly changes. What citizens once called private property becomes, in the eyes of the state, available resources. History shows how this story ends. Not with polite defaults or careful restructuring. But with the sudden realization — often arriving at the end of a dusty road — that the state has decided it knows exactly where the wealth is. The Roman Republic learned this lesson many times. A Roman Senator and the Praetorian Guard A Roman senator sits on the shaded portico of his villa in Campania. The afternoon air is warm. A Greek slave reads Homer — the fall of Troy, a city that believed its walls eternal. The senator listens half-heartedly. His thoughts drift to accounts and estates: grain from Sicily, rents from vineyards in Gaul, and the gold he accumulated during his years as governor of Upper Gaul. Then he sees it. A cloud of dust rising on the distant road. Hoofbeats follow. Praetorian cavalry. He does not need to ask why they have come. The emperor — perhaps Tiberius, perhaps another — has declared him an enemy of the state. The charges will be vague: corruption, disloyalty, treason against Rome. But the senator knows the real reason. The treasury is empty. They are not coming for his slave. They are not coming for his harvest. They are coming for his gold. What will follow will be described as justice. As necessity. As fairness in service of the Republic. But it is confiscation. Pure and simple. And it has happened before. And it will happen again. The Oldest Pattern in Politics When states run out of money, they follow a path as old as civilization itself. The sequence rarely changes: Deficits → Currency Debasement → Capital Controls → Confiscation It does not matter whether the system is a monarchy, a democracy, or a revolutionary regime. The motive is the same everywhere. Power must be preserved. Politicians who spend win elections. Rulers who distribute wealth secure loyalty. Debt postpones consequences. Eventually, the bill arrives, and the state begins searching for assets. By now the pattern should be obvious. History shows where it looks first. Stage One — The Appetite of the Empty Treasury Empires rarely collapse because of invasion first. They collapse because of promises they cannot afford. Athens offered one of the earliest warnings. In the 5th century BC, Pericles moved the treasury of the Delian League from Delos to Athens. Funds meant for collective defence quietly became funding for monuments — the Parthenon, temples, and civic works glorifying the city. The money belonged to the alliance. But Athens spent it anyway. Rome repeated the pattern centuries later. Civil wars drained the treasury. Armies demanded pay. Politicians promised land and rewards to veterans. When money ran out, Rome found another solution. Proscriptions. In 82 BC, Sulla published lists of wealthy citizens in the Forum. Anyone named could be killed without trial. Their property was confiscated by the state. Heads of the condemned were sometimes displayed in the Forum — a grim reminder that the lists were not theoretical. Gold flowed into the treasury. A generation later, the Second Triumvirate — Mark Antony, Octavian, and Lepidus — revived the practice. Thousands died. Estates were seized. Even Cicero Rome’s greatest orator, was hunted down and executed. Armies were paid. Power was secured. Stage Two — The Vanishing Coin When confiscation cannot keep pace with spending, rulers turn to the currency itself. Rome provides the textbook case. In the early empire, the silver denarius contained nearly pure silver. By the third century AD, emperors desperate to fund armies and bureaucracies began diluting it. Silver content collapsed. The coin looked the same. Its value did not. Prices surged. Trade faltered. Confidence vanished. Diocletian imposed price controls. Constantine introduced new coinage. But the underlying problem remained. The state was spending far more than it could fund. Modern governments rarely debase coins with copper. They achieve the same effect through monetary expansion, inflation, and debt monetization. Savings lose value. Capital begins searching for refuge. And throughout history, that refuge has often been gold. Stage Three — The Locked Vault When capital begins fleeing a failing monetary system, governments respond predictably. They close the exits. China provides early examples. The reformer Wang Mang attempted sweeping nationalizations of land and wealth during the first century AD. Centuries later, the Qing emperor Yongzheng confiscated fortunes of officials accused of corruption. Modern history offers equally stark examples. In 1968, India passed the Gold Control Act, restricting private ownership of bullion and forcing citizens to convert holdings into jewelry or surrender them to the financial system. In 2013, Cyprus delivered a shock. Depositors woke to discover their bank accounts frozen. Withdrawals were restricted. A portion of deposits was simply seized to recapitalize failing banks. The message was unmistakable: wealth inside the system can be trapped overnight. Stage Four — The Final Claim Eventually the state turns toward the asset citizens believed would protect them from monetary collapse. Gold. History offers relentless examples. During the French Revolution, the government seized church lands and precious metals to support the collapsing assignat currency. In 1933, the United States ordered citizens to surrender their gold. Private ownership was banned; citizens were forced to sell at $20.67 per ounce. Shortly afterward, the government raised the price to $35. The difference went to the state. In India, gold ownership was restricted for decades. In Cyprus, deposits became the target. The pattern is clear: gold is treated as insurance by citizens,
The China Imperative India’s Race Against Time : Vikas Sehgal, Saurav Agarwal
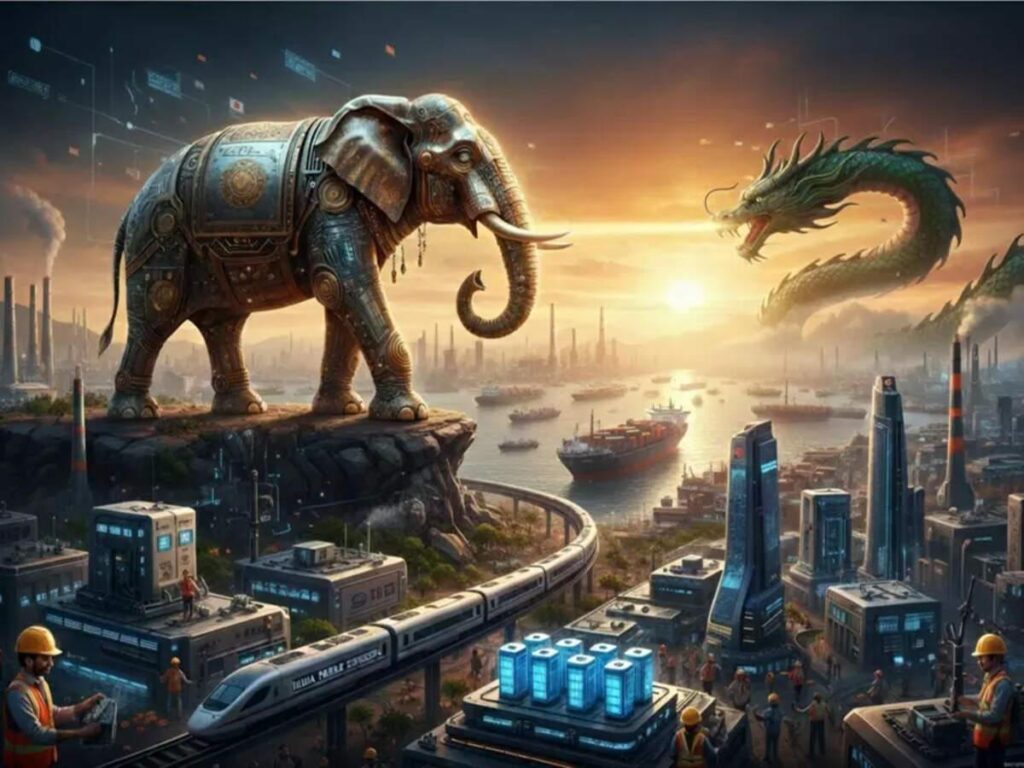
The China Imperative Indias Race Against Time The China Imperative Indias Race Against Time Why factories, not handouts, will decide India’s future. While India promises ₹15,000 crore in welfare handouts, China quietly builds 500 factories per month. One country is spending on votes. The other is building power. The gap is widening—and it is not just about money. It is about factories, technology, energy security, and industrial depth. Every year India delays industrial investment, China adds more factories, more research labs, and more supply chains that the world will rely on for decades. This is not a drill. Political handouts may win elections. But factories win wars, build independence, and secure futures. India’s race is not just economic—it is existential. And time is already running out. Factories, Not Votes India’s industrial base remains shallow. Manufacturing contributes roughly 15–17% of GDP, compared with 30–35% in China. Research and development is similarly lagging: India spends 0.8–1% of GDP, China 2–2.5% (note: of a base that’s 5x that of India) Energy infrastructure is unreliable. Logistics remain fragmented. Ports, rail networks, and power grids are far behind global standards. The result: India cannot scale production in critical sectors like electronics, electric vehicles, shipbuilding, or industrial machinery. Meanwhile, China builds the factories that supply the entire world. Every year India dithers, China compounds its advantage. This is the arithmetic of power. Factories, supply chains, and energy security do not wait for elections. The Cost of Welfare Politics Meanwhile, electoral politics reward short-term spending. Cash transfers, subsidies, and schemes like Ladli Behna multiply across states. The annual cost of these programs runs into tens of thousands of crores, often funded by borrowing. Borrowing for consumption is easy. Borrowing for capital is hard. But it is the hard choices that determine national destiny. Every rupee spent on welfare programs is a rupee not invested in a factory, a research lab, or an industrial corridor. India’s fiscal numbers tell a worrying story: combined central and state debt is now 85–90% of GDP, with interest payments consuming over 23% of government revenues—more than defense spending. This is debt funding short-term happiness, while long-term power erodes silently. Geopolitics Is Unforgiving India shares a long and contested frontier with China, whose economy is roughly $20+ trillion—nearly five times India’s $4+trillion. China produces three times more manufactured goods, spends four times as much on R&D, and dominates high-tech industrial sectors from electronics to EVs to shipbuilding. Economic scale is not abstract. It translates directly into military capability, technological dominance, and strategic leverage. Dominant powers rarely tolerate rising neighbors unchecked. Every month India delays industrialization, China widens the gap. Historical benchmarks suggest that for India to remain strategically autonomous, it must eventually reach 40–60% of China’s GDP. Today, India sits closer to 20%. Below that threshold, sovereignty becomes increasingly theoretical. At best, India risks becoming a quasi-vassal—formally independent, but structurally constrained. Lessons from History History is merciless. The Ming Dynasty in China collapsed when fiscal mismanagement and subsidies undermined industrial and military capacity. Short-term generosity calmed the population but hollowed out power. Within decades, the dynasty fell, replaced by the Qing. Modern parallels abound. Argentina squandered its prosperity on consumption and subsidies; Sri Lanka collapsed under the weight of debt-funded populism. The lesson is simple: nations that prioritize capital survive. Nations that prioritize handouts drift into dependency. The Urgency Is Now Consumption does not build power. Capital does. Factories matter. Technology matters. Energy matters. Supply chains matter. Rhetoric does not build nations. Balance sheets do. India still has a narrow window. Build factories now. Invest in technology now. Accumulate national capital now. Because the arithmetic of power compounds as relentlessly as the arithmetic of debt. Political incentives push in the opposite direction. Every election expands giveaways. Every subsidy becomes permanent. Every promise must be outbid by the next politician. This is how fiscal systems drift toward collapse. Economics does not care about slogans. Mathematics does not respond to compassion narratives. Debt compounds quietly—until suddenly it doesn’t. Nations rarely collapse overnight. They drift there slowly. And then one day, the world notices. By then, the arithmetic is irreversible. Disclaimer This article is published for informational purposes only and does not constitute investment advice or analysis. The information presented has been sourced from public domains and has not been independently verified. Vasuki Group makes no representations or warranties regarding the accuracy, completeness, timeliness, or reliability of the content. Neither Vasuki Group nor its affiliates, directors, employees, or representatives shall be liable for any errors, omissions, or reliance on the information provided. This article does not constitute an offer, solicitation, or recommendation for any investment, securities transaction, or contractual engagement. Readers should conduct their own due diligence before making any financial decisions. Any views expressed are those of the author and do not necessarily reflect the opinions of Vasuki Group. Further, Vasuki Group may hold or take positions in the market that differ from the views expressed in this article. All rights reserved. Vasuki Group reserves the right to update or modify this article at its discretion. For more information, reach out to us on research@vasukiindia.com.
What Can Warsh Do ? : Vikas Sehgal, Saurav Agarwal

What Can Warsh Do ? What Can Warsh Do ? Let’s skip the complex math, the sacred economic texts, and the chanting about repo facilities. This is basic arithmetic. It doesn’t care who the Fed Chair is. The U.S. economy is roughly a $30 trillion machine carrying about $38 trillion in debt. That debt grows by close to $2 trillion every year, automatically. Interest payments are now approaching $1 trillion annually and compounding at 15–20 percent a year. That’s impressive growth—just not the kind anyone should be celebrating. At this point, asking what Kevin Warsh will do is like asking which button the elevator will press after the cables have snapped. The math problem is painfully simple. The U.S. government spends about $7 trillion a year and collects roughly $5 trillion in taxes. This isn’t politics; it’s subtraction. The idea of “paying down the debt” belongs in the same museum as the gold standard and balanced budgets. To merely stop the debt-to-GDP ratio from getting worse, the United States would need around 8 percent nominal GDP growth every year. For an economy of this size and complexity, that implies something like 5 percent inflation and 2 to 3 percent real growth—and that’s on a good day. To actually reduce the debt burden, the numbers get uglier. You need double-digit nominal growth, which means inflation north of 7 percent alongside positive real growth. At that point, the Fed’s 2 percent inflation target stops being a policy goal and becomes an aspiration. So what will Warsh do? Here’s the uncomfortable truth: Warsh doesn’t decide. Arithmetic does. He’s just the narrator, and there are only two possible stories to tell. In the first story, the Fed fights inflation. Rates rise, inflation comes down, and economists applaud. Then reality intrudes. Interest costs explode, economic growth slows, markets fall, and tax revenues collapse—income taxes, capital gains, stock options, all evaporate. The deficit widens far beyond today’s already grotesque $2 trillion annual increase. Bond yields spike. The dollar wobbles. At that point, the Fed faces a binary choice: print money or default. Default is politically impossible. Printing is patriotic. The dollar dies. In the second story, the Fed fights the debt. Rates come down and inflation takes off. Eggs begin to cost more than gasoline. Wages chase prices. Voters scream. But inflation at 7 to 8 percent performs the only remaining trick in the playbook: nominal GDP surges into double digits, and the debt suddenly looks manageable—at least on paper. Meanwhile, the dollar quietly slips out the back door. And dies. Two paths. Same ending. So no, the real question isn’t what Warsh wants to do. The real question is whether the dollar dies by high interest rates or by inflation. This isn’t policy; it’s choreography. The outcome is already locked in. The only suspense left is how loudly everyone pretends to be surprised. Which brings us to India—and to you. Warsh’s fate is sealed. India’s, and yours, is not. There’s no point debating what the RBI or policymakers should have done when the freight train was still in the distance. You should have heard it coming. Now you can see it, and it’s close. So let’s talk about tomorrow. The survival formula is brutally simple: run, and run fast. Strengthen your balance sheet as quickly as possible. Own assets that effectively short the dollar—the larger your exposure, the better. Watch what China is doing as it buys an extra million barrels of oil a day for its strategic reserves. You may not have storage tanks, but you can position yourself in commodities or equities that benefit from a weakening dollar. The bottom line is unavoidable. Dollar decline is inevitable. The only question is how fast it happens—and whether you get out in front of it. Act accordingly. Disclaimer This article is published for informational purposes only and does not constitute investment advice or analysis. The information presented has been sourced from public domains and has not been independently verified. Vasuki Group makes no representations or warranties regarding the accuracy, completeness, timeliness, or reliability of the content. Neither Vasuki Group nor its affiliates, directors, employees, or representatives shall be liable for any errors, omissions, or reliance on the information provided. This article does not constitute an offer, solicitation, or recommendation for any investment, securities transaction, or contractual engagement. Readers should conduct their own due diligence before making any financial decisions. Any views expressed are those of the author and do not necessarily reflect the opinions of Vasuki Group. Further, Vasuki Group may hold or take positions in the market that differ from the views expressed in this article. All rights reserved. Vasuki Group reserves the right to update or modify this article at its discretion. For more information, reach out to us on research@vasukiindia.com.
The Age of Fiscal Illusion : Vikas Sehgal, Saurav Agarwal

The Age of Fiscal Illusion The Age of Fiscal Illusion When Democracies Run Out of Your Money “Empires rarely collapse because of a single catastrophe. They collapse because the math finally catches up with the politics.” “Democracy is the worst form of government—except for all the others that have been tried.” The observation by Winston Churchill has endured because it captures a fundamental truth. Democracy is inefficient, chaotic, and often irrational. Yet compared with monarchy, dictatorship, or technocracy, it has proven remarkably resilient. But the democracy Churchill defended is not the democracy that exists today. Over the past century, something fundamental has shifted. The relationship between citizens, the state, and economic responsibility has been quietly rewritten. What began as a system grounded in shared obligation has gradually evolved into something else entirely: a political machine capable of redistributing wealth on an immense scale. For decades, the system seemed stable. Now it is colliding with arithmetic. Across much of the world, governments are confronting a problem they can barely admit aloud: they are running out of money that belongs to other people. And history suggests that when states reach this point, the consequences are rarely mild. The Forgotten Contract The earliest democratic systems were built on a simple premise: power required responsibility. In the city-states of ancient Greece, political participation was largely restricted to male citizens who owned property and served in the military. Citizenship was not merely a privilege—it was a burden. The same logic governed the Roman Republic. Property ownership determined political influence, and political influence carried military obligation. Citizens voted for wars—and then fought them. They approved taxation—and then paid it. Political decision-making and economic responsibility were inseparable. Modern democracy gradually dissolved that link. Industrialization, social reform, and the moral force of equality expanded suffrage until nearly every adult gained the right to vote. The transformation was morally compelling and politically inevitable. But it also altered the internal incentives of the system. The ballot box ceased to be merely a mechanism of representation. It became a mechanism of allocation. “Once voters realize the treasury can be accessed through elections, politics becomes a competition to divide the spoils.” Democracy as Distribution In theory, redistributive policies can strengthen societies. Modern welfare states emerged after the devastation of the Second World War and played an important role in stabilizing economies and reducing poverty. But democratic systems operate under powerful incentives. Politicians must win elections. Winning elections requires assembling coalitions. Coalitions are often built through promises. Subsidies. Transfers. Tax credits. Public employment. Industrial policy. Each policy may be defensible on its own. But over time the promises accumulate. And eventually the promises exceed the resources available to fund them. Political rhetoric frequently centers on the idea of “taxing the rich.” It is a potent slogan. But as a long-term fiscal strategy, it rarely works. Capital in the modern world is extraordinarily mobile. Wealthy individuals can shift assets, restructure holdings, or relocate across borders with relative ease. Capital travels lightly. The middle class does not. In practice, the financial backbone of the modern state becomes the salaried professional, the small business owner, and the middle-income household tied to a job and a location. Meanwhile, the political class itself often prospers. Across many democracies, those who enter politics emerge far wealthier than when they began. Public service is theoretically about sacrifice. In reality, there is often no business quite like the business of the state. The Limits of Taxation Eventually, even the most ambitious redistributive systems encounter limits. Economists describe one such limit through the Laffer Curve. At low tax rates, raising taxes increases government revenue. But beyond a certain threshold, higher taxes begin to discourage work, investment, and entrepreneurship. Push the tax burden too far and revenues begin to fall. Many advanced economies are already approaching that boundary. In large parts of Europe and North America, total tax burdens approach or exceed 40–50 percent of GDP. Beyond that level, further increases risk suffocating the economic engine that produces tax revenue in the first place. But democratic systems rarely shrink gracefully. When taxation reaches its limit, governments turn to borrowing. “Debt allows democracies to postpone reality. It does not eliminate it.” The Seduction of Debt Borrowing is politically irresistible. It allows governments to deliver benefits today while shifting the cost into the future. Current voters receive services. Future taxpayers receive the bill. For decades this arrangement appeared sustainable. Interest rates remained low, global savings were abundant, and financial markets willingly absorbed enormous quantities of government debt. But debt compounds. Eventually, interest payments begin consuming large portions of government budgets. Fiscal flexibility disappears. Many major economies have already crossed the threshold where government debt approaches—or exceeds—the size of the national economy. At that point the political choices become brutally constrained. Raise taxes and risk economic contraction. Cut spending and face electoral revolt. Or reach for the oldest fiscal trick in history. Debase the currency. The Ancient Art of Debasement Currency debasement is as old as government itself. In the ancient world, rulers shaved precious metals from coins. In the modern world, governments expand the money supply. The mechanics differ. The outcome is the same. Reduce the value of money, and the real burden of debt declines. As the economist Milton Friedman famously observed, governments have only three ways to finance spending: taxation, borrowing, and inflation. Inflation is taxation carried out quietly. It reduces the purchasing power of wages. It erodes savings. It redistributes wealth from the prudent to the leveraged. For governments trapped by rising debt and political resistance to austerity, inflation is often the path of least resistance. History suggests it is also the path of greatest danger. “When states cannot tax more and cannot borrow more, they print.” Rome: When Money Stops Meaning Anything The late Roman Empire provides a chilling example. During the third century, the empire faced spiraling military costs and political chaos. To finance the state, successive emperors debased the silver denarius. Over time, the coin’s silver content collapsed. Prices surged. Trade deteriorated. Tax collection became increasingly difficult.
AI Goes Deeper Than You Think: Vikas Sehgal, Vinayak Khedekar

AI Goes Deeper Than You Think AI Goes Deeper Than You Think And Rome Already Told the Story The real risk of AI is not unemployment. It is irrelevance. Most people think AI is about jobs. It isn’t. This essay is an attempt to assess the societal impact of artificial intelligence. Rather than beginning with technology, it looks to history—specifically for moments when the supply of labour shifted suddenly and structurally, rather than gradually. One such episode follows the Punic Wars, when Rome experienced a rapid infusion of slave labour—effectively near-zero-cost, abundant, and scalable—which disrupted an agrarian economy built on human effort. In studying how this shift altered economic structures, social order, and political outcomes, this essay seeks to outline not a prediction, but a plausible direction. AI may be unprecedented in form, but not entirely in consequence—and its closest parallel may lie in what such a shock could mean for modern knowledge economies, from Rome then to Bangalore now. To understand the future, the past is not a guide—it is a warning. The morning begins in mist. You stand on a low ridge in Tuscany. The soil is dark, soft, alive. The air carries olives and wet earth. Light moves slowly across vines, grain, stone. This is your land. You—Antonius, a small farmer—work it with your sons, while your wife measures everything without scales: grain, oil, time. Nothing is abundant. Nothing is wasted. Effort becomes income, and income becomes survival. The system holds because the wage holds—even when paid in crops rather than coin. Across a low stone boundary sits another world. The senator’s estate stretches further than you can see. Where your effort defines output, his ownership multiplies it. You notice the difference. It does not yet threaten you. You are a Roman citizen—equal in theory. That theory is about to expire. Then the news arrives. Victory in the Punic Wars. Rome celebrates. You are invited to the villa. Wine flows. Music plays. Then you see them—rows of able-bodied men, chained, silent. Not workers as you understand them, but controlled labour: labour that does not negotiate, does not leave, and does not require wages. You do not understand it yet, but the system has already changed. You will understand later—when reversal is no longer possible. Rome did not invent this moment. It revealed it. Slave labour floods the economy. Small farmers are displaced. Land consolidates. Citizens move into cities without work. Antonius is fictional. What happens to him is not. The next season looks the same. The arithmetic is not. The senator does not hire. His costs collapse. His grain reaches the market first—and cheaper than yours. You work longer. Your sons work harder. It does not matter. You are no longer competing against a better farmer. You are competing against labour priced outside wages. Within two seasons, the outcome is mechanical. You sell—not because you failed, but because the system stopped pricing what you do. Losing the land is not the real loss. You move to Rome. Rome absorbs you. It does not employ you. The streets are full—not of work, but of people. Farmers from across the Republic, displaced by the same force: capital combined with labour that costs nothing. Too many hands. Nothing for them to do. You wake later—not from rest, but from absence. There is nothing to wake up for. The rhythm of life breaks. Your older son stops asking about the farm. Your younger stops trying. The skills you built over a lifetime have no use—even inside your own home. This is not poverty. It is loss of function. The first time you stand in line for grain, you feel it—not hunger, but something deeper. The men around you do not work, yet all will eat. This is annona—grain distribution. Not charity, but control. A system built on a new reality: Rome no longer needs its citizens to produce, only to remain stable. Bread is distributed. Games are organised. Time is filled. Life is not. Then come the voices. The Gracchi brothers—Roman reformers arguing that wealth concentration has gone too far, that the system has detached from the citizen (early populists, inside the Senate). You listen. For the first time, someone names the problem. It is not you. It is the structure. You feel something you have not felt since leaving your land: recognition. They propose restoration—return land, rebuild the link between effort and survival. The Senate resists. Tiberius is killed. Gaius continues, expanding grain, formalising distribution. He too is removed. But the idea survives them. When wages fail, politics replaces them. Then comes Marius—a general who understands the new Rome. He recruits not landowners, but men like you: displaced, unnecessary, surplus (a shift from citizen-army to employer-army). You understand immediately. The Republic no longer needs you, but it will take your son. Your eldest leaves—not for glory, but for income, identity, and purpose. Rome expands. But something fundamental has already broken. Loyalty is no longer tied to land or Republic. It is tied to whoever provides. Rome is not the story. It is the template. What took decades then will take years now. Rome made labour cheap. AI makes labour irrelevant. Slaves required food, control, containment. AI requires power. Slaves could resist. AI cannot. Rome scaled through conquest. AI scales through code. Rome was local. This is global. The modern economy runs on cognition. Cities like London, New York, Bangalore, and Hyderabad convert intelligence into income. That layer is now being priced toward zero. You cannot compete with something that does not need to be paid. Markets will understand this before society does. Multiples compress first. Earnings lose scarcity. Equity reprices before jobs disappear. Employment follows. Then the state—because the modern state is funded by this layer. London is not a city. It is the UK’s tax base. As cognition loses value, the state weakens. Real estate follows income. Offices empty. Valuations fall. Real estate is not property. It is income, capitalised. Remove the income, and it reprices. Banking compresses
Bankrupting Itself: An Indian Story : Vikas Sehgal, Nishant Jain

Bankrupting Itself: An Indian Story Bankrupting Itself: An Indian Story How welfare politics are weakening India while China builds power. The most dangerous policies rarely look dangerous. They arrive wrapped in fairness, empathy, and moral virtue. Politicians have perfected the art of selling policies that are disastrous for the long-term health of the nation—while convincing voters they are acts of generosity. It is not unlike my daughter persuading me to hand over my credit card for a Black Friday spree: everyone feels good… until the bill comes. Human psychology makes this possible. We are wired to admire those who appear to stand for good. In prehistoric tribes, survival depended on appearing fair and aligned with the group. When a predator appeared outside the cave, the tribe had to act collectively. Being perceived as moral increased the odds that others would defend you. Today, modern politicians exploit the same instinct. In India, this instinct has a price. The country is still transitioning from a lower-middle-income stage and desperately needs capital investment—factories, energy, technology, infrastructure. Instead, electoral competition increasingly rewards short-term consumption. Cash transfers, subsidies, and welfare schemes like Ladli Behna multiply across states, costing tens of thousands of crores annually. Borrowing to fund this consumption is like giving sugar to a diabetic: it feels kind, but it accelerates the disease. Imagine a family drowning in debt. One son runs a profitable business. The other spends money. The father borrows more and gives it to the spender. The productive son stays silent to avoid appearing selfish. The spender is happy. The productive son’s silence becomes the family’s downfall. Modern welfare politics often mirrors this pattern. India’s combined central and state debt is nearing 85–90% of GDP. Interest payments alone now consume roughly 23–25% of government revenues—more than the national defense budget. Punjab’s debt exceeds 45% of state GDP. Kerala’s is around 38–40%. West Bengal’s debt is near 37–38%. Productive states such as Maharashtra, Gujarat, and Karnataka carry far lower debt burdens, but fiscal federalism effectively channels capital from the productive to the unproductive. Once welfare commitments appear, they rarely disappear. Each election forces politicians to promise more than the last. Lakhpati behna today. Crorepati behna tomorrow. The arithmetic of generosity compounds quietly—until suddenly it doesn’t. This dynamic is not unique to India. Argentina once ranked among the world’s ten richest economies. Decades of borrowing, populism, and currency debasement reduced it to repeated sovereign defaults. Sri Lanka followed a similar path, culminating in a full-blown fiscal crisis in 2022. History even provides a lesson from India’s neighbor. Late in the Ming Dynasty in China, the court faced mounting pressure to maintain subsidies, grain transfers, and regional appeasement while revenues stagnated. Short-term expedients kept the population calm, but military funding weakened and regional administrations hollowed out. Within decades, the dynasty collapsed, replaced by the Qing. Fiscal decay rarely looks dramatic when it begins—it usually looks compassionate. The Scottish philosopher Adam Ferguson observed that when interest payments exceed defense spending, fiscal foundations begin to crumble. The United States recently crossed that threshold. Less discussed is that India, combining central and state finances, is already uncomfortably close. And then there is geopolitics. India shares a long and contested frontier with China, whose economy is roughly $18 trillion—almost five times India’s $3.7 trillion. China produces three times more manufactured goods, spends over four times as much on R&D, and dominates critical industrial sectors from electronics to shipbuilding to EVs. Economic scale translates directly into military capability, technological edge, and geopolitical leverage. Dominant states rarely tolerate powerful neighbors rising unchecked. For India to remain a civilizational power with real autonomy, its economy must approach 40–60% of China’s size, based on historical benchmarks. Today India sits closer to 20%. Below this threshold, sovereignty becomes increasingly theoretical. At best, the smaller state becomes a quasi-vassal—formally independent, but structurally constrained. Consumption does not build power. Capital does. Factories matter. Technology matters. Industrial depth matters. Rhetoric does not build nations. Balance sheets do. And balance sheets are built through investment, discipline, and industrial ambition—not debt-funded generosity. India still has a narrow window. Build a deep industrial base now. Invest in technology now. Accumulate national capital now. Because the arithmetic of power compounds as relentlessly as the arithmetic of debt. But political incentives push in the opposite direction. Every election expands giveaways. Every subsidy becomes permanent. Every promise must be outbid by the next politician. This is how fiscal systems break. Economics does not care about compassion narratives. Mathematics does not respond to slogans. Debt compounds quietly—until suddenly it doesn’t. Nations rarely collapse overnight. They drift there slowly. And then one day, the bond market notices. By then, the arithmetic is already irreversible. Disclaimer This article is published for informational purposes only and does not constitute investment advice or analysis. The information presented has been sourced from public domains and has not been independently verified. Vasuki Group makes no representations or warranties regarding the accuracy, completeness, timeliness, or reliability of the content. Neither Vasuki Group nor its affiliates, directors, employees, or representatives shall be liable for any errors, omissions, or reliance on the information provided. This article does not constitute an offer, solicitation, or recommendation for any investment, securities transaction, or contractual engagement. Readers should conduct their own due diligence before making any financial decisions. Any views expressed are those of the author and do not necessarily reflect the opinions of Vasuki Group. Further, Vasuki Group may hold or take positions in the market that differ from the views expressed in this article. All rights reserved. Vasuki Group reserves the right to update or modify this article at its discretion. For more information, reach out to us on research@vasukiindia.com.
Temple & Treasury : Vikas Sehgal, Nishant Jain

Temple & Treasury Temple & Treasury Gold—though endlessly discussed—has rarely been a true monetary metal. Not because it lacks monetary value, but because it was almost never used as everyday currency or as a medium of exchange. Gold is the highest-value and cleanest store of wealth. And like any very high-denomination note, it tends to disappear from circulation. It vanishes into treasuries and temple vaults. Ancient state treasuries functioned much like modern sovereign central banks. Over time, they accumulated gold and issued currency in silver or copper. Whatever did not reach the state often found its way into temples. Temples accumulated gold through offerings from both blue bloods and commoners, and issued claims against this wealth—via clay tablets in Mesopotamia or tokens in Egypt. In some cases, temple and state treasury became one. Athens is the classic example: the Acropolis served simultaneously as the treasury of the state and the temple of the city’s presiding deity. What happened in the past tends to echo into the future. As mercantile economies generate surplus, wealth first accumulates in sovereign instruments—once U.S. Treasuries, and increasingly now, gold. This “non-monetary” gold vanishes through a one-way door. Once gold recedes into a state’s vault, it rarely sees the light of day again—often for generations. We are moving toward such a phase. This time, it will not be the temple on a little hill in Aegean , but state treasuries alone that hoard the gold. And interestingly, not every treasury will get to hold it. China, running a surplus of roughly $1.2 trillion, is increasingly refusing U.S. Treasuries. It is shedding Western and Eastern sovereign debt in exchange for commodities and hard assets—gold foremost among them. The world holds roughly $45 trillion worth of gold. China, official balance sheets aside, likely controls close to $2.5 trillion of it. At its current pace of accumulation, it is only a matter of time before China becomes the dominant player—the one holding both the money and the assets in this global game of Monopoly (the chill in monopoly who has all the money and the hotels!). That has never happened before. Still, there’s no need to panic—it’s a few years away. Until then, buy and enjoy what has always lived behind the closed doors of temples and treasuries Disclaimer This article is published for informational purposes only and does not constitute investment advice or analysis. The information presented has been sourced from public domains and has not been independently verified. Vasuki Group makes no representations or warranties regarding the accuracy, completeness, timeliness, or reliability of the content. Neither Vasuki Group nor its affiliates, directors, employees, or representatives shall be liable for any errors, omissions, or reliance on the information provided. This article does not constitute an offer, solicitation, or recommendation for any investment, securities transaction, or contractual engagement. Readers should conduct their own due diligence before making any financial decisions. Any views expressed are those of the author and do not necessarily reflect the opinions of Vasuki Group. Further, Vasuki Group may hold or take positions in the market that differ from the views expressed in this article. All rights reserved. Vasuki Group reserves the right to update or modify this article at its discretion. For more information, reach out to us on research@vasukiindia.com.
The Deal Everyone Won (And No One Did) : Vikas Sehgal , Vasuki India Team

The Deal Everyone Won (And No One Did) The Deal Everyone Won (And No One Did) This was the rare war where everyone won—and that is precisely the problem. This is a scenario—a thought exercise. Not a prediction, but a structured way to think about how power, perception, and markets may evolve when all sides claim victory and no side truly loses. It begins, as these things now do, on television. Donald Trump appears live—grinning, expansive, claiming total victory. In one pocket, metaphorically, sits Nicolás Maduro; in the other, the Ayatollah. The moment is surreal, theatrical, and entirely on brand. Fox News celebrates while CNN laments. Gas drops to $2 a gallon, and the GOP declares victory. And, almost unbelievably, so does Iran. In Tehran, the streets fill. The Ayatollah declares triumph—not just survival, but transformation. The Islamic Republic, he claims, has evolved into something more durable: a theocratic–hereditary order, stabilized under pressure and legitimized through endurance. Iran did not win on the battlefield; it won by not losing. In modern conflict, that is often enough. Behind the spectacle lies the real story. A deal—never fully written and never formally acknowledged—has been made. Not a peace, but a redistribution of influence dressed up as victory. Yemen is quietly settled. Saudi Arabia secures its core interests and exits with a long-delayed win. Lebanon tilts decisively into Israel’s strategic envelope, allowing Benjamin Netanyahu to claim success—no nuclear threat and a northern front effectively contained. Pakistan’s General Asim Munir also declares victory, as such outcomes tend to allow. At the center sits the real arrangement. The Strait of Hormuz is no longer a battlefield but a managed system. Oman and the UAE act as intermediaries, Iran remains inside the framework, and the United States anchors the structure without fully owning it. It is stability without full control—a system held together rather than resolved. Shipping flows resume and energy stabilizes. In the short term, escalation is contained, chokepoints function, and allies are reassured. The United States secures the flow through Hormuz and embeds itself deeper into the control of global trade routes. But the deeper shift is more consequential. This was never just about Iran—it was about flow. With influence over Hormuz and continued dominance over Panama, the United States sits astride the arteries of global trade. Security becomes a service, stability becomes a product, and access is quietly priced. The system is not merely protected; it is monetized. Power shifts from owning resources to controlling the routes through which they move. What emerges is not isolationism, but a doctrine of pathways. At a deeper level, this can be understood as an attempt to contain China—not through direct confrontation, but through control of the system China depends on. In Ender’s Game, Earth pushes the enemy back and contains it within a bounded space. But reality is not fiction. China is not static; it has already demonstrated the capacity to absorb pressure, adapt, and plan across long horizons. Containment is not closure—it is positioning. The United States may shape the system today, only to encounter the same challenge again under different timelines and conditions. America may have the watch, but China may have the time. Yet this cuts both ways. China learns that endurance can force outcomes, but also that miscalculation at scale carries systemic risk. The lesson is not simply confidence; it is calibration. Markets, too, celebrate. Oil prices fall sharply as war risk fades and flows normalize. Risk premia collapse and shipping stabilizes. For a moment, it appears as if the system has reset—energy is cheap, volatility subsides, and stability returns. But only for a moment. Because this was not a resolution. The system did not break; it revealed its terms. Oil no longer trades purely on scarcity; it acquires a structural floor shaped by geopolitics and controlled routes. What replaces the war premium is a managed risk premium embedded in the system itself. Natural gas and LNG markets ease in the short term, but remain strategically tied to regional security frameworks and infrastructure control. Gold tells the deeper story. It dips initially as immediate fear subsides, but then rises again—steadily and structurally. This rise is not driven by panic, but by policy. States begin to accumulate gold as a neutral reserve asset, a form of collateral that sits outside geopolitical alignment. It becomes, in effect, the balance sheet behind sovereignty. Industrial metals such as copper and aluminum rally in the short term on renewed stability, but their longer-term trajectory is driven by infrastructure buildout, electrification, and the expansion of export capacity. Bulk commodities like iron ore and steel stabilize initially, but are increasingly tied to re-industrialization and strategic capacity building. Critical minerals—lithium, rare earths—show limited immediate movement, but their long-term importance surges as nations seek direct control over mines and supply chains. Shipping and freight costs fall sharply in the short term, yet settle at a higher structural baseline as routes become controlled, secured, and priced. Energy and resource infrastructure, relatively unchanged in the immediate aftermath, emerges as a premium asset class, with states investing heavily in ports, pipelines, refining, and defense-linked production. Across the world, nations draw the same conclusion: the U.S. security umbrella is no longer absolute. What follows is not fragmentation, but self-insurance at scale. States build reserves—not just of oil, but across commodities. They secure supply chains, acquire resource assets, and invest in logistical control. Commodities are no longer simply traded. They are secured. A more critical view—contested, but increasingly voiced—suggests that Europe is attempting to sustain a conflict without matching financial, military, or energy depth. Having reduced reliance on Russian energy, it finds itself more dependent on external supply and U.S. guarantees. It is not irrelevant, but it is increasingly reactive rather than decisive—present in cost, yet peripheral in outcome. Russia, in this view, benefits not through decisive victory, but through shaping the field—stretching timelines, shifting priorities, and creating space in Ukraine. It is not a clean win, but it is a repositioning that reinforces a
History does Rhyme : Vikas Sehgal, Nishant Jain

History does Rhyme History does Rhyme A nation goes to war. The war is brutal and ruinously expensive. To survive, it forges alliances with like-minded states facing a common enemy. Fear and necessity bind them together into a powerful league—an organization meant to pool strength, resources, and resolve against a shared threat. The organization works. Member states contribute men, material, and money. Their resources and currencies are linked through treaty and a shared financial system. Treasuries coordinate responses to economic shocks, creating stability and cohesion in the real economy. Mutual defense succeeds. The enemy is held at bay. Over time, the enemy weakens. The league, however, does not dissolve. Instead, it grows into the dominant economic and military force in the region, wielding overwhelming naval and military power. At the center of the league stands one nation—the largest economy, the strongest military. Its currency becomes the de facto reserve currency. Trade settles in it. Power flows through it. Gradually, the balance shifts. The dominant nation becomes the sole serious military power. The others relax, cut spending, and outsource their security. Dependence deepens. The core nation accepts—and internalizes—its central role. Then the price rises. What began as shared defense turns into economic extraction. Contributions increase. Obligations harden. Strategic territories of allies are taken over “for security reasons.” The line between ally and subordinate blurs. In time, the common treasury—once neutral—is moved to the capital of the dominant state. Allies are treated less as sovereign partners and more as dependencies. Dissent is crushed. Compliance is enforced through force, pressure, and sanctions. What was once an alliance becomes an empire—held together by one nation. Reader: This is not the story of the United States and NATO. This is the story of the Delian League—and Athens. History does not repeat. But it rhymes. Disclaimer This article is published for informational purposes only and does not constitute investment advice or analysis. The information presented has been sourced from public domains and has not been independently verified. Vasuki Group makes no representations or warranties regarding the accuracy, completeness, timeliness, or reliability of the content. Neither Vasuki Group nor its affiliates, directors, employees, or representatives shall be liable for any errors, omissions, or reliance on the information provided. This article does not constitute an offer, solicitation, or recommendation for any investment, securities transaction, or contractual engagement. Readers should conduct their own due diligence before making any financial decisions. Any views expressed are those of the author and do not necessarily reflect the opinions of Vasuki Group. Further, Vasuki Group may hold or take positions in the market that differ from the views expressed in this article. All rights reserved. Vasuki Group reserves the right to update or modify this article at its discretion. For more information, reach out to us on research@vasukiindia.com.
Gold Is Being Spent : Vikas Sehgal, Vasuki India Team

Gold Is Being Spent Gold Is Being Spent And that’s why it’s becoming money again In the late summer of 1947, my family ran. We are Punjabi. My family was forced to migrate under threat of Muslim on Hindu violence to India. My grandmother carried her children and ran from mobs, leaving behind a life that could not be packed or priced. She didn’t carry bonds. She didn’t carry a bank cheque book. She didn’t carry grains or silk. She carried gold. Not because it was tradition. Because it was survival. And that gold did not sit idle. It paid for the first meals. It secured shelter. It was pawned to fund my father’s education. It did exactly what it was supposed to do. It carried value across collapse, converted into liquidity when needed, and rebuilt a life on the other side. Had those earrings not been there—or had they not been gold—my father would likely have been hawking vegetables. I would not be writing this. That is the return on gold. And what came after was not just survival. It was a reset. A new life, funded by something that held its value when everything else failed. The gold was spent. The value was not. Gold was not wealth. It was continuity. And if you zoom out far enough, that same pattern—personal then, sovereign now—repeats with almost uncomfortable precision. When a system comes under pressure—war, fiscal collapse, or external shock—it does not abandon gold. It reaches for it. Gold sits at the very end of the hierarchy, untouched in normal times, but decisive when survival is at stake. In crisis, assets reveal their true order. Illiquid gets trapped. Liquid gets volatile. Political gets constrained. Only neutral gets spent. That last category has only one asset. Gold. One of the clearest examples comes from Second Punic War. Rome was pushed to the brink after a series of devastating defeats. Entire armies were wiped out, allies were wavering, and the cost of rebuilding both military capacity and political cohesion was immense. Revenue flows were insufficient, and time was not a luxury the state had. In response, Rome mobilized its reserves—drawing from temple treasuries, melting accumulated gold and silver, and converting them into coinage to fund the war effort. Wealth that had long been symbolic and sacred was turned into liquidity. This was not collapse; it was conversion. And it worked. Rome stabilized, endured, and ultimately emerged as the dominant Mediterranean power. A similar dynamic appears centuries later under Heraclius during the Byzantine–Persian wars. The empire was under extreme strain, with territory lost and finances deteriorating rapidly. Heraclius made the politically and religiously difficult decision to strip gold and silver from churches, melt them down, and mint coin to finance a final campaign. Once again, assets considered untouchable in normal times were mobilized because the system had no other viable options. And again, this act bought time—enough for the empire to mount a successful counteroffensive and stabilize itself. You don’t have to go that far back. A modern and far more relevant example sits with India in 1991. Facing a balance of payments crisis, India quite literally ran out of dollars. Imports were at risk, credibility was collapsing, and external funding had shut down. What followed was politically painful and nationally embarrassing: India pledged its gold reserves—physically shipping them abroad—to raise emergency liquidity. It was not a choice made in strength. It was a necessity forced by arithmetic. But that act bought time. And that time enabled reform. What followed was not decline, but transformation—the post-1991 liberalization that reset India’s economic trajectory. This is the pattern, stripped of ideology. Gold is not what you sell when you are wrong. It is what you use when you have no time left. Now bring that forward into the present, because what we are seeing today is not random selling. It is structured. It falls into three distinct regimes. Call it The Three Faces of Gold Under Stress. First, Gold as Liquidity — The GCC Model. Surplus systems don’t break easily, but when cash flow tightens, they need immediate liquidity without destabilizing their broader balance sheet. The GCC historically recycled oil revenues into gold, U.S. Treasuries, and strategic assets in the West. But in crisis, those assets behave very differently. Selling trophy assets—football clubs, marquee stakes—is slow, politically visible, and value-destructive. Incremental equity sales collapse marginal pricing. U.S. Treasuries, while liquid, are not entirely neutral in a world where security and finance intersect. That leaves gold as the only asset that is deep, liquid, and apolitical. Every other asset has a market. Gold has a clearing price. Everything else is sold at a discount in stress. Gold is sold at a price. If a sovereign were forced to sell a marquee asset like McLaren in stress, it would clear at a discount—possibly a severe one. But gold, even when sold in size, clears at a global benchmark price. No negotiation. No stigma. No cascading collapse in marginal value. When the GCC sells gold, it is not distress—it is precision. It is extracting liquidity from strength without breaking anything else on the balance sheet. Second, Gold as Bridge — The Turkey Model. Here the system is already under pressure. External deficits, currency instability, and constrained access to dollar funding force action. Gold is sold to raise dollars, and those dollars buy time—time to stabilize the currency, manage imports, and prevent disorder. And this is not incidental. Over the last five years, Turkey has been one of the most aggressive official buyers of gold globally—accumulating roughly 400–500 tonnes of gold reserves between 2018 and 2023. That stockpile did not sit idle. It became a usable buffer when external pressure intensified. This is not a view on gold. It is a function of preparation. Gold becomes the bridge between stress and stability. Third, Gold as Power — The Russia Model. This is not about liquidity or survival. This is about architecture. Russia is not selling gold to
Every Empire Dies the Same Way :Vikas Sehgal, Vasuki India Team

Every Empire Dies the Same Way Every Empire Dies the Same Way They miss the next technology. Most civilizations do not disappear because they are weak. They disappear because the technology that once made them powerful becomes obsolete. History is filled with empires that looked permanent—until the rules of power changed. When those rules changed, their decline was often swift and irreversible. Egypt ruled the ancient world for nearly two thousand years. Long before Greece rose or Rome existed, Egypt possessed the most advanced state in the Mediterranean world. Its bureaucracy, agriculture, and armies were unmatched. During the Bronze Age, bronze weapons and chariots defined military power, and Egypt mastered both. But bronze had a hidden weakness. It required copper and tin—metals that had to be imported through fragile trade networks. Then came iron. Iron weapons were not just stronger; they were dramatically cheaper and far more abundant. But iron required extremely high temperatures to smelt, which meant vast quantities of charcoal. Charcoal meant forests. Forests meant geography. Egypt was a river civilization surrounded by desert. It simply did not have the forests needed to produce iron at scale. Assyria did. Situated near the wooded hills of Anatolia and the Levant, Assyria mastered iron metallurgy and equipped its armies accordingly. Within a few centuries Assyria dominated the Near East with iron-equipped forces. Egypt survived, but it never again returned to the center of global power. A civilization that had ruled for millennia missed the next technological age. The pattern would repeat across centuries. In medieval Europe the armored knight was the ultimate weapon of war. A knight was a walking fortress—encased in steel, mounted on a powerful warhorse, and supported by an entire feudal economy. Training one took decades. Equipping one cost enormous wealth. Society itself was organized around sustaining this elite warrior class. Then came a weapon made largely from wood. The English longbow could be wielded by commoners. A skilled archer could release ten arrows in the time it took a knight to cross the battlefield. At battles such as Agincourt in 1415, thousands of English archers faced a much larger French army filled with heavily armored nobles. The result was devastating. The economics of war had changed. A weapon that cost almost nothing could neutralize a system that required immense wealth to maintain. The knight did not vanish overnight, but its dominance ended. Technology had quietly rewritten the cost structure of power. The same dynamic unfolded in South Asia. For centuries Indian armies relied on war elephants as their ultimate battlefield weapon. Elephants towered over infantry formations, crushed cavalry charges, and carried commanders above the battlefield. They were symbols of royal authority and instruments of shock warfare. But elephants belonged to an older military age. In 1526 at the First Battle of Panipat, the Central Asian warlord Babur faced the much larger army of the Delhi Sultan Ibrahim Lodi. Lodi possessed tens of thousands of troops and hundreds of war elephants. Babur’s force was far smaller. But Babur brought gunpowder artillery. When the cannons fired, the explosions terrified the elephants. The animals turned and stampeded through their own ranks. Within hours the Delhi Sultanate collapsed and the Mughal Empire was born. A military system that had dominated the subcontinent for centuries was undone in a single afternoon. Numbers had not changed. Technology had. Even more dramatic was the rise of the Mongols. To the sophisticated civilizations of the thirteenth century, the Mongols appeared primitive. China had cities and advanced engineering. Persia had wealth and scholarship. Europe had castles and armored knights. The Mongols had horses. But their system of warfare was revolutionary. Each warrior rode multiple ponies, allowing Mongol armies to travel extraordinary distances without exhausting their mounts. Their composite bows could penetrate armor at long range, and their decentralized command structure allowed rapid maneuver warfare that stunned slower armies. Mobility became the decisive advantage. Within a few decades the Mongols built the largest contiguous empire in human history, stretching from Korea to Eastern Europe. Civilization had been defeated by adaptation. Modern history offers an even clearer example. At the beginning of the Second World War the most powerful warships ever built were battleships—massive floating fortresses armed with gigantic guns capable of firing shells across vast distances. Nations poured immense resources into these symbols of naval supremacy. Then aircraft carriers arrived. Aircraft launched from carriers could strike ships from hundreds of kilometers away—far beyond the range of battleship guns. In the Pacific War carriers destroyed battleships without ever entering their range. Within a few years the battleship became obsolete. Aircraft had replaced armor. Every military revolution follows the same pattern. A cheaper or more effective technology suddenly destroys the expensive system that once defined power. Iron replaced bronze. Longbows humbled knights. Cannons broke elephant armies. Aircraft replaced battleships. Each time the global balance of power shifted. Today we may be entering another such moment. For five centuries global dominance belonged to maritime powers that controlled the oceans. The Portuguese began the era of oceanic empires. The Spanish expanded it. The Dutch perfected global trade networks. Britain built a navy so powerful that at one point it exceeded the combined fleets of its rivals. In the twentieth century the United States inherited this system. Aircraft carriers became the ultimate instruments of global power projection. Control of the sea meant control of trade. Control of trade meant control of wealth. But the technologies shaping warfare are changing again. Drones, artificial intelligence, autonomous systems, and precision missiles are altering the economics of conflict. In modern battlefields inexpensive drones have destroyed tanks worth millions of dollars. A device costing a few hundred dollars can destroy equipment thousands of times more expensive. When such asymmetries scale, entire military doctrines become unstable. Even the aircraft carrier—the crown jewel of naval power—faces new vulnerabilities. A single carrier costs more than thirteen billion dollars, yet missiles capable of threatening such ships may cost a tiny fraction of that. But the deeper shift may not
Structural Limits of Bottom-Up Equity Investing : Vikas Sehgal, Vasuki India Team

Structural Limits of Bottom-Up Equity Investing Structural Limits of Bottom-Up Equity Investing A Case for Macro Investing Bottom-up equity investing assumes that careful security selection can consistently identify companies that outperform the broader market. Implicit in this belief is the idea that certain firms can grow faster than both real GDP and inflation—that is, faster than nominal GDP—over long periods of time. However, markets are forward-looking. Stock prices already reflect expectations about future growth, earnings, and risk. For a stock to outperform the market, it is therefore not sufficient for the underlying business to grow faster than nominal GDP; it must grow faster than what the market has already priced in. Sustained outperformance thus requires repeated positive surprises relative to consensus expectations (Fama, 1970). For mature companies, this is structurally difficult. Growth in excess of real GDP and sector peers can only arise from a limited set of sources: • Gaining market share from competitors, • Expanding into new geographies or customer segments, or • Achieving lasting improvements in pricing power, productivity, or margins. Crucially, these gains must be achieved profitably and repeated year after year. As industries mature, competitive intensity increases, excess returns attract imitation, and regulatory or capacity constraints emerge. Over time, abnormal returns are competed away—an outcome well documented in asset pricing research (Fama & French, 1993; Fama & French, 2015). While a small number of exceptional companies may outperform for limited periods, identifying and holding a sufficiently large number of such firms within a diversified portfolio is extremely unlikely. This limitation is not merely practical; it is arithmetic. As Sharpe (1991) demonstrates, before costs, active managers as a group must earn the market return. After costs, the average active manager must underperform. For a minority of managers to outperform, a majority must necessarily underperform. Empirical data strongly supports this conclusion. SPIVA scorecards consistently show that fewer than 5% of active managers outperform their benchmarks over five-year periods, with survival-adjusted success rates often falling below 2%. Over longer horizons, the odds deteriorate further. From a simple probabilistic standpoint, sustained outperformance begins to resemble randomness. The probability of beating the market five years in a row is approximately: (1/2)^5 approx 3.1% This aligns closely with observed outcomes. In India, for example, fewer than 3% of fund managers have beaten the market for four consecutive years—no better than what would be expected from random selection (the proverbial monkeys throwing darts). Historical experience reinforces this point. Even legendary investors, including Warren Buffett, have found it increasingly difficult to outperform passive benchmarks or alternative stores of value over extended periods. This reflects not a failure of skill, but the increasing efficiency, scale, and competitiveness of modern financial markets. It is worth noting that in earlier stages of market development—such as India in its more nascent phase—a small group of investment managers with disproportionate access to information were able to generate sustained outperformance. However, as markets mature, information becomes widely disseminated, competition intensifies, and such advantages erode. In mature markets, consistently beating the market through stock selection alone becomes not just difficult, but implausible—strengthening the case for macro-driven and asset allocation–based investment approaches. By Vikas Disclaimer This article is published for informational purposes only and does not constitute investment advice or analysis. The information presented has been sourced from public domains and has not been independently verified. Vasuki Group makes no representations or warranties regarding the accuracy, completeness, timeliness, or reliability of the content. Neither Vasuki Group nor its affiliates, directors, employees, or representatives shall be liable for any errors, omissions, or reliance on the information provided. This article does not constitute an offer, solicitation, or recommendation for any investment, securities transaction, or contractual engagement. Readers should conduct their own due diligence before making any financial decisions. Any views expressed are those of the author and do not necessarily reflect the opinions of Vasuki Group. Further, Vasuki Group may hold or take positions in the market that differ from the views expressed in this article. All rights reserved. Vasuki Group reserves the right to update or modify this article at its discretion. For more information, reach out to us on research@vasukiindia.com.
The Quiet Collapse of Trust :Vikas Sehgal, Vasuki India Team

The Quiet Collapse of Trust The Quiet Collapse of Trust In the middle of the third century, a Roman merchant stood in a marketplace counting coins. They looked familiar enough. Each bore the image of the emperor, the same profile that had circulated through the empire for generations. To anyone glancing quickly, they appeared identical to the silver coins Rome had minted for centuries. But the merchant paused. He weighed one in his hand, then another. Something felt wrong. The coins were lighter. The metal duller. What had once been solid silver had been thinned and alloyed with base metals. The emperor’s face was still there. The authority of Rome was still stamped upon the surface. But the substance beneath it had changed. So the merchant did something small—almost invisible in the grand sweep of history. He set the coins aside and asked to be paid in something else. Grain. Metal. Anything real. It was a quiet decision, one man in one marketplace adjusting to a subtle change in money. Yet multiplied across thousands of merchants, soldiers, tax collectors, and traders, decisions like that slowly began to reshape an empire. Because when money loses trust, everything built upon it begins to change. Monetary debasement is often described in technical terms: the dilution of currency, the expansion of supply, the erosion of purchasing power. But historically, debasement is something deeper. It is the quiet secession of trust. Money has value not because of paper, metal, or digital entries on a ledger, but because it represents a shared belief that value stored today will retain its value as before meaningful tomorrow. When that belief weakens, behavior begins to shift. Empires rarely collapse at the moment they begin to weaken. They fade first in the realm people trust most instinctively—money. Coins and currencies are not important because of what they are made of; they are important because they are promises made visible. For nearly two centuries the Roman denarius was among the most trusted coins in the world. Minted in high-quality silver, it circulated across a vast trading network stretching from Britain to the deserts of Arabia. It was more than currency. It was trust made portable. Merchants accepted it without question, soldiers fought for it, and tax collectors demanded it. Across thousands of miles it allowed trade between strangers who would never meet. But empires are expensive. Wars multiply, bureaucracies expand, and infrastructure must be maintained. By the second century Rome faced mounting fiscal pressure. Emperors confronted a familiar political choice: raise taxes openly or dilute the currency quietly. They chose dilution. The need to increase money supply is noble. Its prime objective is to expand trade. This was easy until empires could contain their kingdoms and put every user through the same set of discipline, rules and perhaps religion like an intranet. It became complex when same money / coin / metal had to be exchanged between different geographies / heterogenous set of rule / value systems / religions which has led us to where were today. Over the course of the second and third centuries, the silver content of Roman coinage steadily declined. What began as nearly pure silver gradually became alloyed with base metals until the empire’s main coin contained only trace amounts of precious metal. To the naked eye the coin looked unchanged. The emperor’s portrait still gleamed on its surface. Yet its substance had been hollowed out, and behavior changed with it. Merchants began hoarding older coins with higher silver content. Soldiers increasingly demanded payment in goods. Taxes were sometimes collected in grain, livestock, or supplies rather than currency. Long-distance trade—the circulatory system of the Mediterranean economy—began to slow. Not dramatically at first, but just enough that trust became conditional. That is how systems begin to end: not with explosions, but with hesitation. One recent event to meditate upon is mandated a conversion to 1 Euro = 1.955 DM on December 31, 1998 which most would remember vividly. However much larger was phenomena of making West Mark : East Mark as 1:1 for unification of West Germany with East Germany Euro zone in 1990 from 5/7:1 earlier. So if somebody has 1 Million West Marks in 1989 would was diluted by 700% versus East marks in 1990 to arrive at 1.955 DM which was further diluted by ~50% in 2000 on the remaining value effectively leaving him with value worth 150,000 West Marks worth or 15% of original value within a period of a decade. There are many more such examples in like Turkey, Argentina etc. However the DXY and DM are rich man’s debasement examples. Chart 1 — Decline in Silver Content of Roman Coinage Year Approximate Silver Content 50 AD ~95% 150 AD ~85% 200 AD ~50% 250 AD ~20% 270 AD ~5% As monetary cohesion weakened, political cohesion soon followed. The empire did not shatter overnight; it began to fray. In the west a breakaway polity later known as the Gallic Empire governed large parts of Gaul and Britain. In the east the Palmyrene Empire, centered in modern Syria, asserted control over crucial trade routes linking the Mediterranean to Asia. These were not barbarian invasions but internal adaptations to declining central credibility. Rome did not lose Gaul and Palmyra because it lacked legions. It lost them because provincial elites no longer trusted the center to maintain value—monetary or military. When the imperial promise weakened, regions began insulating themselves. Debasement became decentralization, and decentralization gradually became fragmentation. The empire still existed, but the idea of its indivisibility had already begun to dissolve. Modern civilization rests on a similar abstraction. Not silver coinage, but global settlement. The U.S. dollar is not merely a national currency; it is the accounting language of global trade, sovereign debt, commodities, shipping insurance, and capital markets. It is the settlement layer that allows strangers across oceans to transact without fear. That belief allows ships to cross oceans, insurers to underwrite risk, and corporations to stretch supply chains across continents. It
Hormuz Controls More Than Oil :Vikas Sehgal, Vasuki India Team
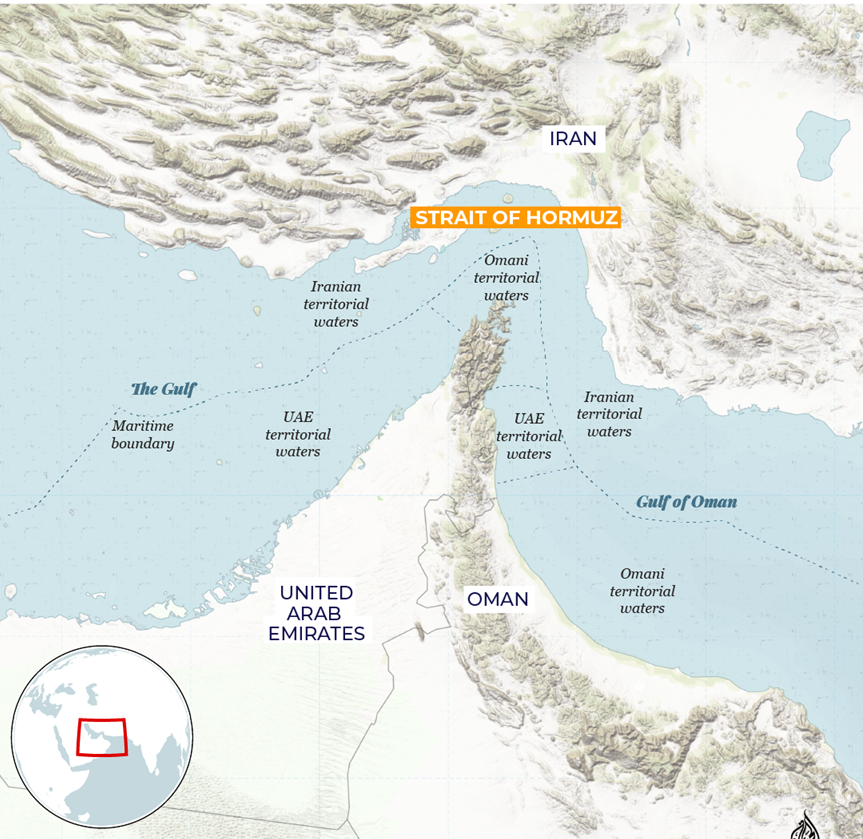
Hormuz Controls More Than Oil Hormuz Controls More Than Oil The Strait of Hormuz is usually described as the world’s most important oil chokepoint. Nearly one-fifth of global oil consumption passes through this narrow waterway each day. But oil is not the only thing that flows through the Gulf. The region also powers one of the largest labor migration systems in human history. Across Saudi Arabia, the UAE, Qatar, Kuwait, and Oman, tens of millions of migrant workers keep economies running — building cities, staffing hospitals, maintaining infrastructure, driving logistics networks, and sustaining the daily functioning of wealthy energy states. Most of these workers come from South and Southeast Asia, as well as parts of Africa. Their labor does not just support Gulf economies. It sustains their home countries through remittances — the money they send back to their families every month. Globally, remittances now exceed $850 billion a year, making them one of the largest financial flows in the world — larger than foreign aid and, in many countries, more stable than foreign investment. For several economies, these flows are not supplementary. They are structural. Remittances from workers abroad provide a critical share of national income: • Pakistan: roughly $30–35 billion annually, about 8–10% of GDP • Philippines: about $35–38 billion, roughly 9% of GDP • Bangladesh: around $22–25 billion, about 6% of GDP • Egypt: more than $30 billion annually • Nepal: nearly 25% of GDP For many of these countries, remittances exceed foreign aid, rival export earnings, and provide the foreign currency needed to import food, fuel, and medicine. Pakistan offers a striking example. Over the past two decades remittances have grown from a relatively modest flow into one of the largest pillars of the economy. Today they represent a vital source of foreign exchange, helping stabilize the currency and finance essential imports. Remove this flow and the pressure on the economy would become immediate. When analysts think about geopolitical disruptions, they tend to focus on the most visible consequences. If the Strait of Hormuz were closed, oil prices would spike. Tanker traffic carrying roughly 20 million barrels of oil per day would be disrupted. Global energy markets would convulse. These are the first-order effects — the ones that dominate headlines. But complex systems rarely unravel at the first shock. The deeper disruptions often appear in the second and third layers of the system. The Gulf is not just an energy hub. It is also a vast employment engine for migrant labor. Construction cranes across Dubai, Riyadh, and Doha are powered by workers from Pakistan, India, Bangladesh, Nepal, Egypt, and the Philippines. Entire communities in these countries depend on the salaries earned in the Gulf. If a major conflict in the region — perhaps one involving Iran — were to close the Strait of Hormuz for an extended period, the immediate impact would indeed be felt in oil markets. But a quieter chain reaction would begin at the same time. Energy exports would slow. Government revenues across the Gulf would shrink. Infrastructure projects would halt. Private sector activity would contract. And millions of migrant workers could suddenly find themselves without jobs. When that happens, remittance flows collapse quickly. But an even more powerful shock follows. The workers themselves come home. History offers glimpses of how disruptive that moment can be. During the 1990–91 Gulf War, Iraq’s invasion of Kuwait triggered a sudden exodus of foreign labor. Nearly two million migrant workers fled the region within months. Egypt repatriated hundreds of thousands of citizens almost overnight. Jordan absorbed an influx equivalent to nearly 10% of its population in a single year, straining housing, labor markets, and public finances. More recently, the COVID-19 pandemic created a smaller but revealing version of the same phenomenon. As Gulf economies slowed and travel halted, hundreds of thousands of migrant workers returned to South Asia. Regions that depended heavily on remittance income experienced sudden economic stress as household incomes disappeared and local job markets struggled to absorb returning workers. These episodes were temporary shocks. A prolonged closure of Hormuz could produce something far larger. If Gulf economies slowed sharply, millions of migrant workers could begin returning to their home countries over a relatively short period of time. Remittance inflows would shrink just as domestic labor markets suddenly faced a surge in job seekers. The consequences would cascade through several channels at once. Households that depended on monthly remittances would lose their primary source of income. Local businesses would lose customers. Foreign currency inflows would fall, placing pressure on exchange rates and making imports more expensive. Governments already struggling with debt and fiscal constraints would face rising unemployment and growing social pressure. And the returning workers themselves would not be the same individuals who originally left. Many would come back with savings, international exposure, and new expectations. They would have seen higher wages, functioning infrastructure, and more efficient systems of governance. Returning to economies with limited opportunity can produce frustration as well as awareness. When large numbers of such workers return simultaneously, the pressure on social and political systems can rise quickly. A prolonged disruption in the Strait of Hormuz might or might not resolve whatever conflict triggered it — whether a confrontation involving Iran, Israel, or a wider regional war. But the consequences would not remain confined to the Gulf. They would travel quietly along migration routes and financial channels — through Karachi, Dhaka, Cairo, and Manila. Oil tankers might stop moving through Hormuz. Soon after, millions of workers could begin moving the other way — back toward economies that cannot easily absorb them. And one of those economies is Pakistan, a politically fragile country of more than 240 million people, already under economic strain — and armed with nuclear weapons. The Strait of Hormuz may control the flow of oil. But in a deeply interconnected world, it also helps control the flow of people, money, and stability far beyond the Gulf itself. By Vikas Sehgal Disclaimer This article is published for informational purposes only and does
The Byzantine Conundrum :Vikas Sehgal, Vasuki India Team
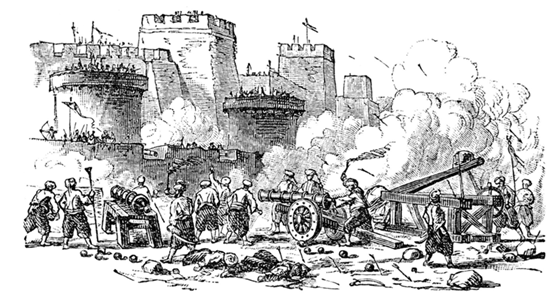
The Byzantine Conundrum Why People Stay Until the Walls Collapse: People generally spend weeks comparing televisions—panel types, refresh rates, warranty clauses—yet give little thought to their financial future, the inevitability of old age, or whether the system they rely on will still exist when they need it. Minor decisions invite obsessive analysis; major ones are quietly outsourced to belief. Belief is not a virtue. It is a cognitive sedative.It allows people to stop thinking while reassuring themselves that they are faithful, patriotic, or historically informed. Most belief systems are not built on evidence, but on hope stitched together with selective readings of the past. Once belief hardens, facts are no longer examined—they are filtered. Constantinople was not a surprise Constantinople did not fall in 1453 because its citizens were uninformed. It fell because they did not leave their belief system.Mehmed II had made his intentions unmistakable. He reinforced roads and bridges to move massive siege cannons. He constructed a fortress to sever the city’s access to the Black Sea and named it Boğazkesen—“throat-cutter.” This was not subtle diplomacy; it was an announcement. And yet, the population stayed.They believed the Virgin Mary protected the city. They believed prophecies that claimed Constantinople would fall only at the end of time. They believed that survival in the past guaranteed safety in the future. Belief replaced strategy.By the time belief collided with reality, the gates no longer mattered. The Dollar is today’s Constantinople The US dollar now occupies the same psychological space.There is no credible scenario in which the purchasing power of the dollar survives. The question is not whether the dollar continues to exist, but whether it retains meaning. On that point, the verdict is almost certain. Yet belief persists. Americans believe in exceptionalism—the shining city on a hill, the reserve currency forever, the system too big to fail. The rest of the world plays along, not because the logic holds, but because abandoning belief is uncomfortable, disruptive, and costly.Listen carefully to financial media and hedge-fund royalty. You will hear elaborate narratives, but never the obvious conclusion stated plainly: the dollar is doomed in real terms. The Math Doesn’t Care About Belief. This is not about debt-to-GDP ratios. That metric is a distraction. The real constraint is cash flow.The US collects roughly $5 trillion in taxes. Mandatory spending—entitlements, defense, and interest—already exceeds that amount. This is not a future problem. It is a present one, concealed by confidence and complacency. There are only two theoretical escape routes. Both end the same way. Scenario One: Tax Your Way Out Raise taxes aggressively. Double them. Push tax intake to 60% of GDP.In theory, revenues surge. In reality, markets collapse. Capital gains disappear. Consumption contracts. Bonuses, equity compensation, and risk-taking evaporate. The tax base shrinks.The state collects less, not more. Debt becomes unserviceable. The printing press follows. The debt is paid. The currency is not. Scenario Two: Grow Your Way Out The political favorite.Growth requires inflation. Inflation expands entitlements, inflates defense spending, and drives bond yields higher—exploding interest costs. Yes, inflation erodes the real value of debt, but only by destroying the currency. The balance sheet survives. The citizen does not. The outcome is identical, in either of the scenarios. Why People Don’t Leave This raises an age-old question. When great cities in antiquity fell to invading forces, why didn’t the people leave?But Constantinople in January 1453 was different. This was the capital of an empire, watching the siege assemble in slow motion. Why don’t the citizens of today’s “City USD” leave? Because belief is easier than action.Because leaving early looks foolish—until it doesn’t. Because the system still functions just well enough to dull urgency. People would rather debate dinner plans than confront monetary decay.They stayed because everyone else stayed. They stayed because history feels abstract—until it isn’t.The citizens of Constantinople did not stay because they were stupid. They stayed because they were human.And humans do not abandon cities—monetary or physical—until the walls are already breached. By then, belief is worthless, and exits are crowded. The Cruel Irony Ironically, the endgame is less catastrophic for Americans than for much of the rest of the world.Post-debasement, the United States will still sit atop one of the most productive lands ever known—rich in energy, water, sunlight, technology, and backed by the most powerful military in history. The real damage lands elsewhere. Global trade stalls. Debt-servicing crises ripple outward. Japan buckles under its balance sheet. Europe faces food and energy stress. Emerging markets fracture. Even oil exporters panic, gold vanishes from shelves, and bailouts are sought. India’s GDP contracts; welfare promises evaporate; cities riot.In theory, the world should already be running for the exits.In practice, it is doing so slowly, cautiously, politely. Like the citizens of Constantinople, the world knows the walls are weakening—but is still calmly deciding what’s for dinner. History does not announce collapse; it normalizes it. The Implication for India (No Illusions) India will not be a spectator. It will be collateral.India’s growth rests on three brittle pillars: energy priced in dollars, trade settled in dollars, and capital funded in dollars.A weaker dollar does not make India richer. Foreign capital will not exit gradually. It will vanish. India has land, labor, and demographics. None of them protect against monetary shock. The tragedy is not that India will suffer. The tragedy is that it will suffer unprepared, because belief once again feels safer than action. Disclaimer This article is published for informational purposes only and does not constitute investment advice or analysis. The information presented has been sourced from public domains and has not been independently verified. Vasuki Group makes no representations or warranties regarding the accuracy, completeness, timeliness, or reliability of the content. Neither Vasuki Group nor its affiliates, directors, employees, or representatives shall be liable for any errors, omissions, or reliance on the information provided. This article does not constitute an offer, solicitation, or recommendation for any investment, securities transaction, or contractual engagement. Readers should conduct their own due diligence before making any financial
Why $20,000 Gold Would Be Bad News for Everyone :Dhruv Joglekar ,Vikas Sehgal

Why $20,000 Gold Would Be Bad News for Everyone Why $20,000 Gold Would Be Bad News for Everyone If gold ever trades at $20,000 an ounce, it won’t mean the world is richer. It will mean the world’s financial foundation has cracked. Gold does not rise like that because people suddenly fall in love with gold. It rises like that when people lose faith in what gold is priced against—chiefly U.S. dollars and U.S. government bonds. Historically, every explosive move in gold has coincided not with prosperity, but with stress in the monetary system. The 1970s. The post-2008 era. The post-pandemic period. The pattern is consistent. A $20,000 gold price would not be a commodity signal. It would be a credibility signal. Most people think U.S. government bonds are just another investment asset. They are not. For sovereigns, they are savings accounts. They sit at the core of national balance sheets, backing currencies, pension systems, banks, and insurance companies. As of 2024, foreign countries hold roughly $7.5 trillion of U.S. Treasuries (U.S. Treasury TIC data). Japan alone holds about $1.1 trillion, China around $800 billion, with Europe, the UK, and oil exporters making up much of the rest. These are not trading positions. They are reserves. When those bonds lose real value, the loss does not disappear into theory. It shows up directly on sovereign balance sheets, pension solvency calculations, and banking capital ratios. One country’s debt is another country’s asset. If the asset stops protecting purchasing power, the damage propagates outward. At $20,000 gold, the message would be unmistakable: Treasuries no longer preserve value in real terms. That message would already imply years of failed financial repression, negative real yields, and monetization. The chain reaction is mechanical. Countries holding large quantities of Treasuries appear weaker overnight. Their own government bonds, backed by those reserves, are suddenly questioned. Funding costs rise. Currencies come under pressure. Central banks are forced to intervene, burning reserves that markets already distrust. This is not a stock-market problem. It is a sovereign credibility problem. Equity markets can recover from crashes. Reserve assets do not recover trust once it is lost. The UK sits near the front of the fault line. The country runs a persistent current-account deficit, importing more than it exports. It depends on continuous foreign capital inflows to function. Its pension system is large, yield-sensitive, and structurally leveraged. In 2022, a modest rise in yields nearly collapsed the system, forcing the Bank of England into emergency bond purchases to stabilize pension funds (Bank of England Financial Stability Report, 2022). That was during a localized shock. In a global bond crisis—signaled by a vertical move in gold—the UK would almost certainly require external support. And that support would still be denominated in the very dollar system under stress. Liquidity can delay consequences. It cannot restore trust. Japan’s problem is scale. Its government debt exceeds 250 percent of GDP (IMF World Economic Outlook). The system works because yields are suppressed and reserves are assumed to be stable. If reserve assets weaken materially, Japan faces an impossible trilemma: defend the yen, defend the bond market, or defend economic growth. It can pick two on a good day. In a global crisis, it can pick one. Europe appears more insulated, but only on the surface. Stability there rests on institutional trust—shared fiscal rules, mutual confidence, and the belief that stress in one member state will not infect the rest. A global bond shock tests that belief directly, particularly for highly indebted countries where debt-to-GDP ratios already exceed 120–140 percent (Eurostat). Gold at $20,000 would strain that trust faster than any election ever could. China looks different. Its reserve composition is less bond-heavy. It holds fewer foreign government securities and more real assets—commodities, domestic savings, infrastructure, and gold. According to the World Gold Council, China has been the largest official buyer of gold for several consecutive years, while also absorbing most of its domestic mine production internally. Capital controls further reduce the risk of sudden reserve flight. At very high gold prices, China does not need to announce any return to a gold standard. It simply appears more solvent by comparison. In a crisis, relative solidity matters more than absolute purity. This is not a prediction. It is a warning. Gold may not reach $20,000. But if it does, the problem will not be gold. The problem will be the silent realization that the world’s savings were built on assets that promised safety—but delivered dilution. At that point, gold is no longer an investment. It is a signal that the damage is already done. Written By Dhruv Joglekar & Vikas Sehgal Disclaimer This article is published for informational purposes only and does not constitute investment advice or analysis. The information presented has been sourced from public domains and has not been independently verified. Vasuki Group makes no representations or warranties regarding the accuracy, completeness, timeliness, or reliability of the content. Neither Vasuki Group nor its affiliates, directors, employees, or representatives shall be liable for any errors, omissions, or reliance on the information provided. This article does not constitute an offer, solicitation, or recommendation for any investment, securities transaction, or contractual engagement. Readers should conduct their own due diligence before making any financial decisions. Any views expressed are those of the author and do not necessarily reflect the opinions of Vasuki Group. Further, Vasuki Group may hold or take positions in the market that differ from the views expressed in this article. All rights reserved. Vasuki Group reserves the right to update or modify this article at its discretion. For more information, reach out to us on research@vasukiindia.com.
Where Did the Gold Go? :Dhruv Joglekar ,Vikas Sehgal

Where Did the Gold Go? Where Did the Gold Go? Where Did the Gold Go? Gold is one of the rare assets where we can make a reasonable estimate of total supply. According to the World Gold Council, about 216,000 to 220,000 tonnes of gold have been mined over all of human history. Because gold does not rust, decay, or disappear, almost all of it still exists today—locked away as jewelry, bars, coins, or official reserves. Each year, global mining adds only 3,000–3,500 tonnes, about 1 to 1.5 percent of the existing stock. In practical terms, gold is almost a closed system. What matters is not how much is produced, but who absorbs it—and whether it ever comes back to the market. That leads to a simple but powerful rule: whoever steadily buys gold and does not sell it eventually gains control over the system, even if they do so quietly. Gold production today is concentrated in a small group of countries. China has been the world’s largest producer since 2007, mining roughly 350–400 tonnes a year. Russia, Australia, South Africa, and a few others follow. But production alone does not explain what has happened to the global gold stock. The real story begins after the gold leaves the mine. This is where China becomes central—and where global perception lags reality. Gold is unlike most commodities because it has a buyer with unlimited patience: central banks. Central banks do not trade gold. They accumulate it and store it. Once gold enters a central bank vault, it effectively disappears from the active trading market. As of 2024, central banks officially hold about 37,000 tonnes of gold, roughly 17 percent of all gold ever mined. Official rankings suggest the United States dominates this landscape, reporting 8,133 tonnes—by far the largest declared reserve. China, by contrast, officially reports only about 2,300 tonnes. On paper, the gap looks enormous. But paper is exactly the issue. Americans now claim ownership of roughly 40 percent of all bitcoins ever mined, while China controls close to 20 percent of all the gold ever extracted from the earth. The contrast is not cultural or technological; it is structural. One system maximized financial abstraction and mistook liquidity for control. The other accumulated physical finality. Digital assets depend on continuous operation—markets, power, networks, and law. Gold depends on none of these. When systems compress, accounting claims lose priority and custody asserts itself. What matters then is not who maintains the ledger, but who holds the asset that settles without permission. The United States last conducted a full audit of its gold reserves in the 1950s. Since then, the reported number has barely changed, despite enormous changes in the global monetary system. The figure may be accurate—but it rests largely on trust. China operates differently. Start with domestic production. Over the past two decades, China has mined roughly 7,000–8,000 tonnes of gold. Chinese law prohibits the export of domestically produced gold. Once it is mined, it stays inside the country. That fact alone puts China’s internal gold stock well above its officially reported reserves. Next come imports. Since the 2008 financial crisis, China has been a steady buyer of gold through global hubs such as London and, most visibly, Switzerland. Swiss customs data show thousands of tonnes of gold flowing east over the past decade. Much of this gold is recast into 1-kilogram bars, the format preferred by Chinese banks and institutions. Analysts who track refinery output and bar flows estimate that 4,000–5,000 tonnes have moved east this way alone. Then there are bilateral and off-market transactions. China has accepted gold as payment for goods and infrastructure from countries facing sanctions or dollar shortages, such as Iran. It has also reportedly received gold directly or indirectly through energy and weapons trade with Russia. These deals rarely pass through transparent markets and are not captured in official reserve statistics. Finally, there is domestic absorption. Chinese households are among the largest gold buyers in the world, using gold jewelry and bullion as a parallel savings system. At the same time, state-owned banks, policy banks, and state enterprises hold physical gold on their balance sheets under categories like “bullion” or “precious metals.” These holdings do not appear in central-bank reserve data reported to the IMF. Put all of this together—domestic mining, Swiss imports, sovereign transactions, gold-for-goods trade, institutional holdings, and household ownership—and a very different picture emerges. Conservative estimates suggest China controls more than 15,000 tonnes of gold. Less conservative, but still plausible, estimates place the number closer to 25,000 tonnes. Including private holdings, China may effectively control over 20 percent of all the gold ever mined on Earth. Not officially. Not transparently. But functionally. And unlike Western gold, much of this metal is immobile. It is not sitting in ETFs. It is not lent into the market. It does not circulate through bullion banks. It is held—quietly, patiently, and strategically. The rest of the world, meanwhile, behaves like a pigeon in front of a cat—eyes shut, hoping nothing changes. Yet the implications are profound. A country that can stare down the United States in trade wars, dominate rare-earth supply chains, and still hold enough gold to potentially back a large share of its currency presents a deeply unsettling scenario for the global financial system. Something has already changed. For the first time since the age of imperial treasure fleets—since the era of Zheng He—China has accumulated a share of the world’s ultimate monetary asset that rivals historic empires. Not to signal power. Not to trade. But to insulate itself and wait. Gold hasn’t vanished. It has simply moved east—and it is unlikely to return anytime soon. Written By Dhruv Joglekar & Vikas Sehgal Disclaimer This article is published for informational purposes only and does not constitute investment advice or analysis. The information presented has been sourced from public domains and has not been independently verified. Vasuki Group makes no representations or warranties regarding the accuracy, completeness, timeliness, or reliability of the content.
Harshit Dand : India’s Naval Build-Up: The Rise of a Strategic Shipbuilding Power
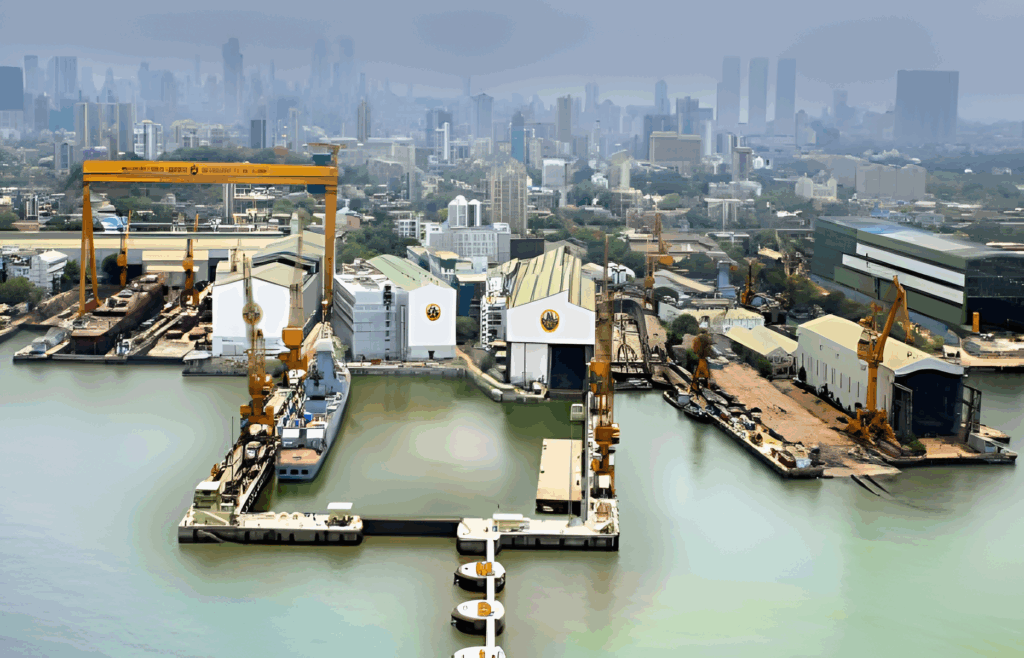
India’s Naval Build-Up: The Rise of a Strategic Shipbuilding Power Setting the Context: Why Naval Power Matters More Than Ever India’s defence shipbuilding sector is entering a long-term growth phase, evolving from a strategically reserved sector into a key pillar of national security and manufacturing. Backed by a strong naval modernisation pipeline and policy support, this shift is strengthening maritime deterrence and reducing import dependence. The Global Naval Balance: Where India Stands Today Image Source: Nuvama & Philip Capital Research Reports While India operates a balanced naval fleet, its overall strength remains significantly smaller than that of China, the United States, and Russia. This gap underlines the need for sustained and long-term naval expansion. Two-Front Maritime Reality: The China-Pakistan Axis India’s maritime security is increasingly shaped by a two-front challenge, driven by China’s growing presence in the Indian Ocean and Pakistan’s expanding naval capabilities. This coordinated pressure raises the need for stronger sea-lane control, credible deterrence, and a larger, more technologically advanced naval fleet. Present Naval Capability and the Target Fleet Vision While India’s warship fleet is currently modest, it is expanding rapidly. With over 60 ships under construction, 70-80 more planned, and a target of ~175-200 warships by 2035, India is undertaking one of its largest naval buildouts- focused on indigenised, high-value platforms rather than just numbers. The Next Decade of Shipbuilding: Major Platforms in the Pipeline Over the next decade, India’s naval shipbuilding pipeline spans submarines, frontline warships, amphibious vessels, and support platforms- together representing an opportunity of nearly Rs. 3 lakh crores. The navy is now ordering entire ship classes in larger numbers, signalling a shift from one-off projects to continuous fleet expansion and long-term visibility. Image Source: Philip Capital Research Report Policy as a Force Multiplier: Government Push Behind the Sector Defence shipbuilding push is driven by a clear policy framework, not demand alone. Reforms under the Defence Acquisition Procedure (DAP) prioritise domestic procurement, higher indigenous content, and long-term contracts, while supporting technology transfer and defence exports. Together, these policies are strengthening India’s shipbuilding ecosystem. Following the Money: Defence and Naval Capex on a Structural Uptrend Image Source: Philip Capital Research Report Naval modernisation is now firmly backed by rising capital allocation. Naval capex has more than doubled since FY18, while warship procurement has nearly tripled- raising the navy’s share of defence capital outlay to the mid-teens. This sustained increase shows that shipbuilding is a long-term strategic priority, not a cyclical spends. Image Source: B&K Research Report This naval expansion sits within a structurally rising defence capex cycle. Capital expenditure now makes up around 20-25% of total defence spending and is expected to grow at a high-teens pace, with the navy’s share steadily increasing to support fleet renewal and shipbuilding. Beyond Steel and Hulls: Indigenisation, Technology & Electronics Modern warships are highly complex systems that combine propulsion, sensors, weapons, and software into a single combat platform. India has moved well beyond hull construction to successfully design and integrate many of these systems, with warships showing strong execution and design maturity. Indigenous content has risen from under 30% in the early 2000s to ~70% in current destroyers and frigates, with upcoming platforms targeting up to 90%. Importantly, electronics now account for ~ 30–40% of a warship’s value- covering combat management systems, radars, sonars, EW, communications – many of which are increasingly developed domestically. Import dependence is being reduced through higher indigenisation, technology transfer with global peers, and rising domestic R&D. This shift is guided by the Technology Perspective and Capability Roadmap (TPCR), a 15-year blueprint issued by India’s Ministry of Defence that aligns shipbuilding with future technologies such as advanced propulsion, autonomy, sensors and EW, steering India toward a technology-driven, self-reliant, and future-ready naval force. Image Source: Technology Perspective Capability Roadmap 2025 Unlocking the Non-Defence Opportunity in Shipbuilding Beyond defence, commercial shipbuilding and ship repair offer a strong adjacent opportunity to Indian shipyards. Despite handling nearly 95% of India’s trade by sea, India accounts for less than 1% of global commercial shipbuilding. Image Source: Mazagon Dock Shipbuilders Shipyard in Mumbai To bridge this gap, the government has launched a Rs. 70,000 crore Shipbuilding & Maritime Development package, granted infrastructure status, and introduced financial assistance and interest subvention, and is developing coastal shipbuilding and repair clusters to improve competitiveness and scale MRO activity. Sources: Industry research reports, company disclosures, government publications, and official press releases. Written By : Harshit Dand Disclaimer This article is published for informational purposes only and does not constitute investment advice or analysis. The information presented has been sourced from public domains and has not been independently verified. Vasuki Group makes no representations or warranties regarding the accuracy, completeness, timeliness, or reliability of the content. Neither Vasuki Group nor its affiliates, directors, employees, or representatives shall be liable for any errors, omissions, or reliance on the information provided. This article does not constitute an offer, solicitation, or recommendation for any investment, securities transaction, or contractual engagement. Readers should conduct their own due diligence before making any financial decisions. Any views expressed are those of the author and do not necessarily reflect the opinions of Vasuki Group. Further, Vasuki Group may hold or take positions in the market that differ from the views expressed in this article. All rights reserved. Vasuki Group reserves the right to update or modify this article at its discretion. For more information, reach out to us on research@vasukiindia.com.
Dhruv Joglekar : Silver in now in the limelight amid new U.S. Tariff Regime and Strong Fundamentals

Silver in now in the limelight amid new U.S. Tariff Regime and Strong Fundamentals Why Silver Is Capturing Attention 1. Tariff Triggered Safe-Haven Demand New U.S. tariff measures have revived fears of stagflation and disrupted supply chains, prompting investors to seek refuge in precious metals. Gold responded immediately, and silver followed—benefiting not just from its safe-haven status but also its industrial demand profile. (Image source: Reuters) 2. Undervaluation via the Gold–Silver Ratio The gold-to-silver ratio remains historically elevated, pointing to silver’s relative undervaluation. A reversion toward long-term norms often results in silver outperforming. This dynamic is drawing investor interest and inflows. (Image source: Crescat capital) 3. Persistent Supply Deficit For a fifth year running, silver supply (mining plus recycling) fails to meet industrial and investment demand, particularly from sectors like solar and EVs. Disruptions in mining and refining could tighten supply further. 4. Record ETP Inflows In H1 2025, cumulative net inflows into silver ETPs reached 95 million ounces—already surpassing 2024’s totals—with total holdings climbing to 1.13 billion ounces, just 7% below the February 2021 peak. June alone accounted for nearly half of the inflows, the largest monthly surge since the 2021 Reddit-driven rally. 5. Macro Tailwinds Rate Outlook: Ongoing trade-headline volatility and moderation in inflation could prompt the Fed to begin easing later in 2025. Dollar Pressure: Tariff and growth concerns are weighing on the U.S. dollar, bolstering demand for dollar-denominated assets like silver. Sources: Reuters, The Silver Institute, Mining.com, FXStreet, GlobeNewswire, Futunn, CaratX, TrotterInc, InvestingNews and Kitco Written by: Dhruv Joglekar Disclaimer This article is published for informational purposes only and does not constitute investment advice or analysis. The information presented has been sourced from public domains and has not been independently verified. Vasuki Group makes no representations or warranties regarding the accuracy, completeness, timeliness, or reliability of the content. Neither Vasuki Group nor its affiliates, directors, employees, or representatives shall be liable for any errors, omissions, or reliance on the information provided. This article does not constitute an offer, solicitation, or recommendation for any investment, securities transaction, or contractual engagement. Readers should conduct their own due diligence before making any financial decisions. Any views expressed are those of the author and do not necessarily reflect the opinions of Vasuki Group. Further, Vasuki Group may hold or take positions in the market that differ from the views expressed in this article. All rights reserved. Vasuki Group reserves the right to update or modify this article at its discretion. For more information, reach out to us on research@vasukiindia.com.
Dhruv Joglekar : Impact of Recent U.S. Tariff Hikes on Indian Metal Exports: A Legal and Economic Perspective

U.S. Tariff Impact on Indian Metal Exports Impact of Recent U.S. Tariff Hikes on Indian Metal Exports: A Legal and Economic Perspective Date: July 2025 The U.S. government’s recent policy actions on metal tariffs have generated discussion across global trade corridors. This article outlines the current tariff environment, assesses potential escalation risks, and evaluates the impact on India’s metal exports to the United States. All data is based on publicly available sources from official trade bodies and media reports. A. Tariff Situation: Then and Now In March 2025, the United States imposed a 25% tariff on all steel and aluminium imports, covering both raw and finished products1. This was subsequently raised to 50% on June 3, 2025. India responded by filing a formal notification at the World Trade Organization (WTO), expressing its intent to impose reciprocal tariffs on certain U.S. goods. B. Outlook: Can Tariffs Increase Further? While the tariffs are now at 50%, the probability of a further increase is considered low. From a policy and diplomatic standpoint, 50% is viewed as a high-water mark in current trade dynamics. Comparable tariffs have been levied on other U.S. trading partners such as Canada, suggesting a level playing field is being maintained5. Analysts also speculate that a potential trade agreement with India could lead to more targeted tariff applications, focusing on specific product categories rather than a flat rate. India also maintains its own protective mechanisms—such as a 12% safeguard duty on select flat steel imports from China—which may mitigate some of the external pressure from U.S. tariffs. C. Trade Exposure: How Important Is the U.S. to Indian Metal Exports? India’s steel exports to the United States are relatively limited, while aluminium exports are more material. Only about 5% of India’s total steel production is exported; of this, roughly 1% goes to the U.S. In contrast, approximately 47% of India’s aluminium production is exported, with the U.S. accounting for 6% of those exports. From the U.S. side, over half of its aluminium imports come from Canada, and only about 3% come from India. For steel, major U.S. import sources include: Canada (23%) Brazil (16%) Mexico (12%) South Korea (10%) In FY25, India exported an estimated USD 4.56 billion worth of iron, steel, and aluminium products to the United States: $587.5 million in iron and steel $860 million in aluminium and related articles $3.1 billion in articles of iron or steel D. Historical Context: Is This a First? No. The aluminium and steel industries have previously been subject to U.S. trade actions. In January 2018, the U.S. administration under President Donald Trump imposed a 10% tariff on aluminium and 25% on steel imports from most countries, excluding Australia. These measures aimed to boost domestic production but were met with mixed results. U.S. aluminium production actually declined after the tariffs. Historically, such tariffs had limited impact on global benchmark prices, including those on the London Metal Exchange (LME). Conclusion While the latest U.S. tariff increases are significant, India’s direct exposure—particularly in steel—is limited. Aluminium exports are more impacted but remain a small part of overall U.S. imports. The situation remains fluid, and upcoming trade negotiations will play a key role in determining the long-term outcome. Sources Reuters – “Trump to sign order doubling metals tariffs” (June 3, 2025) Times of India – India plans retaliatory tariffs under WTO (May 13, 2025) Economic Times – India revises retaliatory duties plan (July 10, 2025) Reuters – “Explainer: The reality of Trump’s steel and aluminium tariffs” (June 2, 2025) Moneycontrol – “India may hit back at US with tariffs on almonds, metals” (June 2025) Reuters – “India mulls retaliatory tariffs as US rejects WTO notice” (June 2, 2025) Reuters – “US aluminium premiums hit record levels after tariffs” (June 5, 2025) U.S. Geological Survey – Mineral Commodity Summaries 2025 (Aluminium) U.S. Department of Commerce – SIMA Steel Import Reports DGFT India – Export-Import Data FY25 U.S. Federal Register – Proclamation 9704 (January 2018 tariffs) International Aluminium Institute – Primary Production Statistics London Metal Exchange – Historical Aluminium & Steel Price Data Written by: Dhruv Joglekar Disclaimer This article is published for informational purposes only and does not constitute investment advice or analysis. The information presented has been sourced from public domains and has not been independently verified. Vasuki Group makes no representations or warranties regarding the accuracy, completeness, timeliness, or reliability of the content. Neither Vasuki Group nor its affiliates, directors, employees, or representatives shall be liable for any errors, omissions, or reliance on the information provided. This article does not constitute an offer, solicitation, or recommendation for any investment, securities transaction, or contractual engagement. Readers should conduct their own due diligence before making any financial decisions. Any views expressed are those of the author and do not necessarily reflect the opinions of Vasuki Group. Further, Vasuki Group may hold or take positions in the market that differ from the views expressed in this article. All rights reserved. Vasuki Group reserves the right to update or modify this article at its discretion. For more information, reach out to us on research@vasukiindia.com.
Deepak Pawar – Navigating Uncertainty: How the Iran-Israel War Threatens India’s Trade Flows

Navigating Uncertainty: How the Iran-Israel War Threatens India’s Trade Flows Synopsis: The ongoing Iran-Israel conflict poses significant risks to India’s trade, especially due to rising crude oil prices, disruptions in shipping routes, and increased insurance and freight costs. As tensions between Iran and Israel escalate, the economic tremors are being felt far beyond the Middle East. For India—deeply integrated into global trade and heavily reliant on energy and fertilizer imports—the conflict poses serious macroeconomic and sectoral challenges. Disruptions in shipping lanes, rising freight costs, and supply chain vulnerabilities are already beginning to strain key industries. Trade Disruption and Export Exposure In FY2025, India exported goods worth $1.24 billion to Iran and $2.15 billion to Israel, while importing $441.9 million and $1.61 billion from these countries, respectively. However, the broader threat lies in the disruption of key maritime routes. The Strait of Hormuz and the Red Sea—which together handle nearly 80% of India’s merchandise trade with Europe and a significant portion of trade with the US—are now under threat. These regions account for 34% of India’s total exports. Map of Strait of Hormuz: Wikipedia Source: commerce.gov.in Source: Vasuki India – Strategic Research Risk to Indian Export War risk premiums for containers have surged from $50–$200 to $200–$400. Transit times via the Cape of Good Hope are increasing by 15–20 days, raising freight and insurance costs by a similar margin. India’s exports to Israel have already dropped from $4.5 billion in FY24 to $2.1 billion in FY25, while imports fell from $2.0 billion to $1.6 billion. Sectoral Impact Several of India’s high-performing export sectors are particularly vulnerable: Pharmaceuticals, which rely on stable access to Middle Eastern and North African markets. Textiles and home furnishings, especially to Israel, where margins are 10–15% higher than in the US. Gems and jewellery, electronics, and engineering goods, which face both demand-side risks and supply-side shocks—particularly from disruptions in Israel’s rough diamond exports. Basmati rice exports to Iran, India’s third-largest buyer, are expected to decline. In FY25, India exported ₹6,374 crore worth of Basmati rice to Iran, accounting for 12.6% of total Basmati exports. Fertilizer Sector: A Fragile Supply Chain India’s fertilizer sector is especially exposed due to Iran-Israel war. Nitrogen fertilizers like urea depend on ammonia, derived from natural gas—60% of production costs stem from this input. Phosphorus fertilizers like Diammonium Phosphate (DAP) require phosphate rock and sulphur, while potassium fertilizers rely on potash ore. Global fertilizer Supply: The Middle East and North Africa (MENA) region supplies over 30% of the world’s nitrogen fertilizers. Iran exports over 16 million tonnes of urea annually. Morocco holds 70% of global phosphate rock reserves. Russia and Belarus account for nearly 40% of global potash capacity. Any disruption in these supply chains—whether from sanctions, shipping delays, or conflict escalation—could trigger a lagged price shock. Within 1.5 to 2 months, fertilizer prices may rise sharply. Farmers, facing higher input costs, may reduce usage, leading to lower agricultural yields. Prices of Di-ammonium Phosphate (DAP) and Urea USD/T on June 17, 2025 Ripple Effects in India The Indian government may be forced to increase fertilizer subsidies, straining the fiscal deficit. If subsidies are not scaled up, food inflation could rise, especially in rural areas. The war could lead to rise in Energy Prices and Inflationary Pressure. The conflict has already pushed Brent crude oil prices to $76 per barrel, with a 12% surge since the escalation began. JPMorgan warns that prices could reach $120 per barrel in a worst-case scenario. A $10 increase in crude oil raises India’s oil import bill by ~ $12–13 billion annually, widening the current account deficit by ~ 0.3% of GDP. The Indian rupee has already weakened to ~ ₹86 per USD, adding to import costs. Higher oil prices could also impact sectors like paints, tyres, cement, and chemicals, which rely on crude derivatives. Written by: Deepak Pawar Disclaimer This article is published for informational purposes only and does not constitute investment advice or analysis. The information presented has been sourced from public domains and has not been independently verified. Vasuki Group makes no representations or warranties regarding the accuracy, completeness, timeliness, or reliability of the content. Neither Vasuki Group nor its affiliates, directors, employees, or representatives shall be liable for any errors, omissions, or reliance on the information provided. This article does not constitute an offer, solicitation, or recommendation for any investment, securities transaction, or contractual engagement. Readers should conduct their own due diligence before making any financial decisions. Any views expressed are those of the author and do not necessarily reflect the opinions of Vasuki Group. Further, Vasuki Group may hold or take positions in the market that differ from the views expressed in this article. All rights reserved. Vasuki Group reserves the right to update or modify this article at its discretion. For more information, reach out to us on research@vasukiindia.com.
Deepak Pawar – India’s 2025 Monsoon Outlook: Foodgrain Output, Sugar Sector Stability, and Evolving Fertilizer Trends

Monsoon Outlook 2025 India’s 2025 Monsoon Outlook: Foodgrain Output, Sugar Sector Stability, and Evolving Fertilizer Trends India is expected to receive above-average rainfall in 2025, with projections at 105% of the long-term average of 868mm. The absence of El Niño conditions and the potential development of La Niña later in the season are contributing to the positive monsoon outlook. While most regions are likely to experience above-normal rainfall, certain areas in northwest, northeast, and southern Peninsular. For more details, please click here . Written by: Deepak Pawar Disclaimer This article is published for informational purposes only and does not constitute investment advice or analysis. The information presented has been sourced from public domains and has not been independently verified. Vasuki Group makes no representations or warranties regarding the accuracy, completeness, timeliness, or reliability of the content. Neither Vasuki Group nor its affiliates, directors, employees, or representatives shall be liable for any errors, omissions, or reliance on the information provided. This article does not constitute an offer, solicitation, or recommendation for any investment, securities transaction, or contractual engagement. Readers should conduct their own due diligence before making any financial decisions. Any views expressed are those of the author and do not necessarily reflect the opinions of Vasuki Group. Further, Vasuki Group may hold or take positions in the market that differ from the views expressed in this article. All rights reserved. Vasuki Group reserves the right to update or modify this article at its discretion. For more information, reach out to us on research@vasukiindia.com.
Deepak Pawar In Conversation with DD Sahyadri – Banda Rupaya, Sharing view on Equity Market, Agro Sector, Sugar sector and Chemical Sector.

Source: DD Sahyadri Deepak Pawar In Conversation with DD Sahyadri – Banda Rupaya, Sharing view on Equity Market, Agro Sector, Sugar sector and Chemical Sector. https://www.youtube.com/watch?v=xWndO4XJu7k
Dhruv Joglekar – INDIA’S PASSIVE FPI OUTFLOWS MAY SOON BOTTOM AS USDINR NEARS 88-89

India’s Passive FPI Outflows May Soon Bottom as USDINR Nears 88-89 INDIA’S PASSIVE FPI OUTFLOWS MAY SOON BOTTOM AS USDINR NEARS 88-89 Summary Passive Foreign Portfolio Investment (“FPI”) outflows from India may soon turn as USDINR moves towards 88-89. Historical trends show a median depreciation of 6.6% in trough-to-peak cycles over the last decade, with an average of 7.9%. If this pattern holds, the rupee could reach 88-89 by Q1 FY26, possibly reversing passive FPI outflows. Historical patterns indicate that major depreciations in USDINR tend to follow phases of appreciation. The most notable depreciation in recent history occurred during the 2013-14 Taper Tantrum when the currency fell by ~16% within 3-4 months after FPI flows peaked at $14.8 billion. A similar decline was seen in 2018 due to trade war concerns, a 100-bps Fed rate hike, and domestic uncertainties linked to GST implementation, resulting in $25 billion in FPI outflows. Given past trends, if current factors affecting the exchange rate persist, USDINR could rise to 88-89 by April-May FY26 based on median bottom-to-peak moves observed in previous years. Cycles of USDINR and FPI flows show average peak depreciation of 8.3% The US Economy and FPI Inflows: A Surprising Correlation Contrary to common belief, a stronger U.S. economy does not necessarily drive capital outflows from India. Analysis of the Citi U.S. Economic Surprise Index (CESI) and India’s net FII equity flows since 2014 suggests a 25% positive correlation. Additionally, econometric modeling indicates that a 1% positive surprise in U.S. economic data has historically driven an inflow of approximately $82 million into Indian equities, with a lag of around one month. Growth Surprises in the US are Generally Positive for India Flows Correlation between US 10-Year Bond Yields and Indian (or Emerging) Markets Historical data suggests a strong inverse correlation between U.S. 10-year bond yields and emerging market equities, including India. These asset classes often move in opposite directions, with rising U.S. bond yields drawing capital away from riskier markets. When the U.S. 10-year yield exceeds 4.3% to 4.4%, it often marks an inflection point where investors reallocate funds into U.S. bonds. In September 2024, the U.S. 10-year yield was at 3.6%, but it has since risen to 4.6%. This surge has coincided with significant capital flows into U.S. assets, strengthening the dollar and contributing to large-scale FII outflows from India. A 4.5% risk-free return in U.S. dollars presents an attractive alternative, particularly as emerging markets continue to trade at elevated valuations. US 10-year bond yields and Indian (or emerging) markets have high negative correlation (Source: Vasuki Research) Source: Vasuki Research Conclusion: Volatility Ahead, but Structural Strength Remains Although short-term market conditions remain uncertain, India’s long-term fundamentals continue to provide a solid foundation. Fiscal consolidation efforts, steady forex reserves, and resilient domestic flows support economic stability. While USDINR may weaken to 88-89, the expected reversal in passive FPI flows will be a critical development for investors tracking the evolving macroeconomic environment. For more information, reach out to us at research@vasukiindia.com. Disclaimer This article is published for informational purposes only and does not constitute investment advice or analysis. The information presented has been sourced from public domains and has not been independently verified. Vasuki Group makes no representations or warranties regarding the accuracy, completeness, timeliness, or reliability of the content. Neither Vasuki Group nor its affiliates, directors, employees, or representatives shall be liable for any errors, omissions, or reliance on the information provided. This article does not constitute an offer, solicitation, or recommendation for any investment, securities transaction, or contractual engagement. Readers should conduct their own due diligence before making any financial decisions. Any views expressed are those of the author and do not necessarily reflect the opinions of Vasuki Group. Further, Vasuki Group may hold or take positions in the market that differ from the views expressed in this article. All rights reserved. Vasuki Group reserves the right to update or modify this article at its discretion.
Deepak Pawar shares his views discussing general market movement, along with the current scenario of the Sugar and Chemical sectors on Banda Rupaya, DD Sahyadri.

Deepak Pawar was recently interviewed on Banda Rupaya, DD Sahyadri, Discussing general market movement, along with the current scenario of the Sugar and Chemical sectors. Stay tuned for insights! Source: DD Sahyadri https://www.youtube.com/watch?v=KOcU0FIHPQ0
Omkar Tanksale shares views on Infosys Vs TCS

Omkar Tanksale shares views on Infosys Vs TCS !! Here’s What Market Analysts Recommend To Pick In Trade … https://www.youtube.com/watch?v=UI_VVDxKEX0 Source: NDTV Profit
Deepak Pawar shares his views on Sugar, Textile and Insurance sector and on Banda Rupaya, DD Sahyadri.

Deepak Pawar featured on DD Sahyadri on 9th Aug, 2024 Source: DD Sahyadri
Deepak Pawar shares his views on Agro-Agrichem on Banda Rupaya, DD Sahyadri.

Deepak Pawar shares his views on Agro-Agrichem on Banda Rupaya, DD Sahyadri. Source: DD Sahyadri https://youtu.be/b50Trzxi_oY
Deepak Pawar – Agriculture Scenario in India and Future outlook

Agriculture Scenario in India and Future outlook El Niño and La Niña are climate patterns that affect the weather globally. El Niño refers to warmer ocean temperatures in the central-east equatorial Pacific, leading to various impacts like increased flooding and changes in marine life. On the other hand, La Niña involves cooler ocean temperatures in the same region, leading to effects like droughts and heavy rains in different parts of the world. India, along with asian countries faces low and scattered monsoon in El Niño and abundant to heavy rainfall in La Niña. Historical Impact of El-Niño: Past Challenges and Resilience In the past, El-Niño has caused difficulties for farming in India. It led to problems like less rain, affecting crops like rice and sugarcane. Historical data shows that during El-Niño events, agricultural production in India faced setbacks. Crops like rice and sugarcane were particularly impacted by El-Niño. Current Scenario: Facing Water Scarcity and Crop Challenges Currently Western, Central, and Southern regions in India are experiencing water scarcity which is affecting crops such as sugarcane and off-season plantations. Farmers are working hard to adapt to these conditions and find ways to sustain their crops. Water reservoir levels in many regions are lower than previous year as well as long term average. Water scarcity is significantly impacting regions like Northen, Eastern, and Southern India. However, Central region water reserves are at 10 year average while Western India has water availability at levels better than 10 year average but lower than last year. Sowing in Sugarcane, vegetables and pulses are facing challenges due to the scarcity of water. Future outlook: Anticipating Better Monsoon and Agricultural Growth According to initial forecasts by Sky met & IMD, India is likely to witness La Niña phenomenon i.e. return of normal monsoon 2024. The expectation of better rainfall brings optimism for increased agricultural production & fertilizer usage. This positive outlook signals a potential resurgence in agricultural productivity. Agriculture theme can be played in stock markets through sub segments like Seeds, fertilizers, Agrochemicals, Agri equipment’s manufactures & rural consumer products producers. Chart data source:India Meteorological Department Ministry Of Earth Sciences Government Of IndiaReserve Bank of IndiaSkymet Weather
Daljeet Singh Kohli explains why he is overweight on metals

Daljeet Singh Kohli explains why he is overweight on metals Daljeet Singh Kohli to ET Now – featured on 18th Mar, 2024 “Right now, we believe there is a lot of potential there mainly because valuation-wise they are not obscenely high. Second, the way the Indian government is putting focus on infrastructure development and especially after the elections, we expect a lot more push coming on to the infrastructure, so the demand from our side will remain very strong and currency, local as well as international, is in favour. All these factors make a conducive environment for metal stocks and therefore we are exposed to them.” One section of the market believes that the US economy may not be doing that badly. The macro data from China is also supportive. So, metal is the place to be. They are beaten down. There is also a view that if the slowdown continues in these two economies, this metal long trade may be very short lived. Do you believe in this trade or is it just a point A to point B and not worth making it a large part of the portfolio yet? See, we are right now very much overweight on metals. As of now, almost 8% to 10% of our portfolio is exposed to metals and normally metals is a technical call. So, metal is never a three-year, five-year lock-in story that you buy and forget and your next generation will look at it like that. We do not buy metal stock like that because there are so many things which work. There are so many moving parts there. Either it is global macros, it is local macros, then company specific issues. So, metals normally are a trading opportunity only and we have also taken that view. Right now, we believe there is a lot of potential there mainly because one is that valuation-wise they are not obscenely high. Second, the way the Indian government is putting focus on infrastructure development and especially after the elections, we expect a lot more push coming on to the infrastructure, so the demand from our side will remain very strong and currency, local as well as international, is in favour. All these factors make a conducive environment for metal stocks and therefore we are exposed to them.https://youtu.be/F0PA0rXotOw I want to draw your attention to Reliance Industries because even in the recovery that played out post Wednesday, Reliance had a big contribution. What do you think is fuelling the move on Reliance? This is the rotation towards large caps basically. If you have to take money out and there is so much talk about froth being built up in various segments. So, if the institutions are forced to or if they have to get out of certain smaller and mid stocks, then where does that money go? The natural progression is that it has to go to some largecap and within the largecap, probably Reliance is the first choice because it is valuation-wise not very costly. There are a lot of trigger points for the stock to perform. After quite a few months of consolidation, the stock had come out of that phase and started moving to the new highs. So, normally, people would want to go with a stronger stock when they are rotating out of some stocks and especially locking out their profit from those stocks. It is just that rotation which is happening. Trigger points for Reliance remain as it is. The new energy initiatives that they are taking, is a three-four years kind of call. It is not immediate that the profitability will start flowing in, but these days just a hint is enough. Semiconductor stocks are trading at 100 multiples. So yes. At least these guys are spending Rs 75,000 crore on new energy. The market is willing to give them that benefit. How would you play the capex theme right now? What are your favourite capital goods stocks or engineering ones that you have in your portfolio? We are adding some of them. As of now, I do not think we have any capex stock right now. Infrastructure, we have added two-three months back, some road project companies and those we have added. But machinery or cap goods per se, now we are evaluating three-four ideas there. Basically, we tend to go to the mid-end, the smaller ones, instead of just going to the L&Ts of the world and we try to find the niche areas. So, I think there are a couple of ideas which we are working on, maybe in the next one month or so we will be adding some. What about hospital stocks? There is the entire story brewing on how treatments would be regulated and it will be at par with the public sector hospitals. The entire space went through a correction and some of them started trading at 60-70-time one-year forward, still way off the mark from recent peaks. Would you be comfortable getting back there? I am very bullish on the sector as such because this is a place where we see a lot of potential for many years to go. We have such a huge population, penetration levels are so low and there is a huge scope for expansion for all these companies. Now of course you have to be mindful of valuations. Incidentally, in the last two-three years this sector has seen a lot of PE investments, a lot of private investments coming in which have just inflated the valuation to a very large extent. So, probably this Supreme Court ruling actually become a trigger point for people to take some profit out and bring back some sanity in the valuation. I think still valuations are on the frothy side. So, we will have to be very choosy amongst all these stocks. I am very bullish as I said on the sector, but one has to be very choosy while selecting the stock where at least some kind of
Looks like Gold is poised to shine the brightest!!!

Looks like Gold is poised to shine the brightest!!! What really moves gold prices? Real Rate of Return – A combination of Inflation & Interest Rates – moves Gold prices. What is a real rate of return? Real Rate of Return in simple language is: Interest Rate – Inflation If bank fixed deposit is paying 6% interest rate & inflation is 7%, the real return is 6% – 7% = -1% If inflation is 4%, your real return is 6% – 4% = 2% What’s the relationship between real rates & gold prices? Negative Real Rates (-1% in the above example) is supportive of gold prices Positive Real Rates (2% in the above example) works against gold prices Why is this so? Gold is a non interest-baring instrument i.e. does not pay any fixed interest. Hence, whenever rates drop, you make less fixed interest by investing incremental money in fixed income & hence it moves to Gold & When rates go up, you want to invest incremental money in Fixed income & not gold Hence, assuming inflation to be constant, you will invest more in Gold when Interest rate falls to 4% & inflation is 6% = -2% real rate and you will invest less in Gold when interest rate rises to 7% & inflation is 6% = 1% real rate Positive Real Rates (2% in the above example) works against gold prices Apart from Interest Rate & Inflation, does $(DXY) affect gold price? Yes. Gold is traded in $ terms. When $ increases/ strengthens, gold becomes expensive & hence demand is expected to fall & hence the price comes down. But when $ drops/ weakens, gold becomes cheap & hence demand is expected to rise & hence the price is expected to go up. Globally interest rates are expected to top out. Market is expecting rates rate cuts starting middle of 2024; & hence fixed income investors would lean more towards Gold as against fixed income assets When interest rates go down, the currency (Dollar in this case) is expected to soften as well. With this view, the expectation also is that softening dollar will be positive for gold.
The Red Sea issue and what it meant for India Inc

The Red Sea issue and what itmeant for India Inc The Red Sea crisis, also known as the U.S.-Iran proxy war, originated from Houthi rebels’ attacks on Israel in October 2023, causing significant disruptions to global trade via the Red Sea. This includes attacks on commercial vessels, leading to: Increased shipping costs: Ships are taking longer routes, raising fuel consumption and operational costs. Delays in delivery Rerouting adds significant time to shipments, impacting supply chains and potentially leading to shortages. Higher insurance premiums War risk insurance for the Red Sea has soared, adding to costs for businesses. The potential for further escalation remains, which could result in the shutdown of key trade routes, leading to price increases and economic instability worldwide. It’s important to note that the situation is ongoing and its full impact on global trade is still unfolding. However, the potential for significant disruptions and economic consequences remains high. Key point to note: The crisis predominantly affects trade between Europe and Asia, with India particularly vulnerable – with a large portion of its trade reliant on the Red Sea. India Inc – In Q3 2024 management discussion calls, the term ‘Red Sea’ was mentioned 48 times, primarily impacting industries such as Mining and minerals, Manufactured products, chemicals, plastics and rubber materials. Discussions revolved around: Increased freight costs Affecting export-oriented industries, notably steel, pharmaceuticals, and oil. 2. Delays in deliveries due to rerouting, especially impacting exports. 3. South African coal offered at discounted rates due to EU delivery disruptions, benefiting Indian industries. Delays in deliveries Due to rerouting, especially impacting exports. South African coal offered at discounted rates Due to EU delivery disruptions, benefiting Indian industries. As of Q3, the impact on most companies is marginal, with ongoing monitoring for potential future actions. Note: only the companies whose concall transcripts were available on Factset database as on February 8, 2024, are considered
Unravelling the US Banking Puzzle: The Commercial Real Estate Dilemma

Unravelling the US Banking Puzzle: The Commercial Real Estate Dilemma In the world of US banking, the spotlight has turned on the Commercial Real Estate (CRE) portfolio, stirring discussions following the acquisition of Silvergate Bank last year by New York Community Bank. The announcement of increased provisions in its CRE portfolio during the fourth-quarter results on January 31st resulted in a significant 57% decline in its stock and 8% fall in the regional banks index since the result date, as of the closing price on February 7th. This has prompted a closer look at the challenges faced by the sector. Other banks with high exposure to CRE including Zions Bancorp, Valley National Bancorp and Western Alliance Bancorp have also borne the brunt. What is driving this? High-Interest Rates The low-interest rate party of the past decade is officially over. The Federal Reserve’s decision to crank up the federal funds rate has thrown a curveball at the commercial property market. Loans taken at rock-bottom rates now need a refinance makeover at significantly higher rates. Office Vacancy Trends The surge in remote work, born during the COVID era, has elevated office vacancy rates to 19.6%. This shift has adversely affected property demand, potentially leading to defaults on associated loans. Anticipated Impact Delinquency rates are expected to rise as loans mature for refinancing, especially for banks heavily invested in the CRE rollercoaster. What is driving this? The drama seems to be localized, with major banks like JP Morgan and Bank of America sporting less than 5% exposure to the CRE theatrics. The impact appears to be concentrated among regional banks and select foreign banks having high exposure to CRE loans. Despite the CRE challenges, commercial property prices have managed to weather the storm, providing some stability in uncertain times. Also, CRE loan repayments are evenly distributed from 2023 to 2028, with the majority not falling due this year. Conclusion – Finding Balance: As US banks grapple with the intricacies of the CRE market, the overall impact on the economy appears to be manageable. Proactive measures, staggered repayments and the limited exposure of major institutions indicate a more localized challenge than a widespread economic crisis. Relevance in Indian context Indian banks are sipping their chai, unfazed. Stable interest rates, sustained demand for commercial property and a mere 3% exposure mean they’re not hitching a ride on this rollercoaster.